


- Bitcoin Analyst tweeted that the BTC max pain model sits at 13K.
- BTC’s price has been in the green zone within the last week, with a few red patches.
- BTC’s previous two triangles broke down its prices and now BTC is forming its third triangle.
Bitcoin Analyst Willy Woo tweeted that the max pain model sits at $13k as of today, the balanced price at $15k, while the Cumulative Value Days Destroyed (CVDD) is set at 16k.
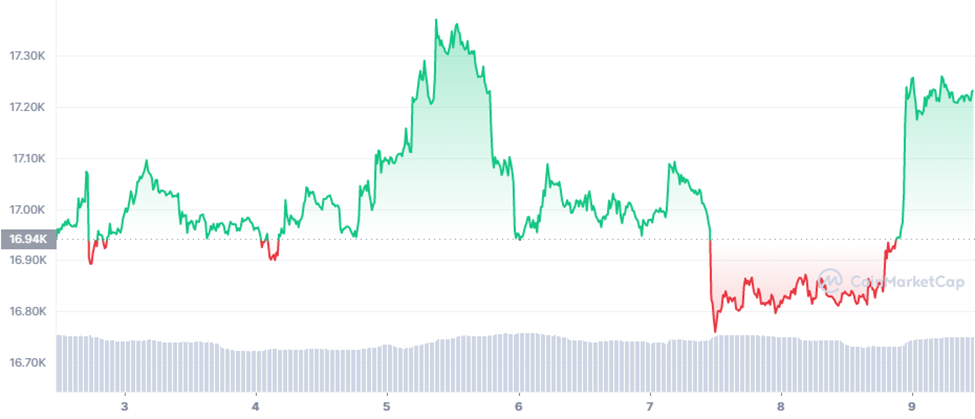
Meanwhile, BTC is up 2.39% in the last 24 hours and is trading at $17,236.31, according to CoinMarketCap. As shown in the seven-day chart of BTC against USD, BTC has been traversing in the green zone except for the few patches of red towards the beginning and end of last week.
BTC hit its highest value of $17,371 on December 5 and tanked to its lowest of $16,759 on December 7. Notably, the price of BTC shot up from $16,927 to $17,232. With a bit more spike in prices today, BTC seems to be rebounding off $17,200.
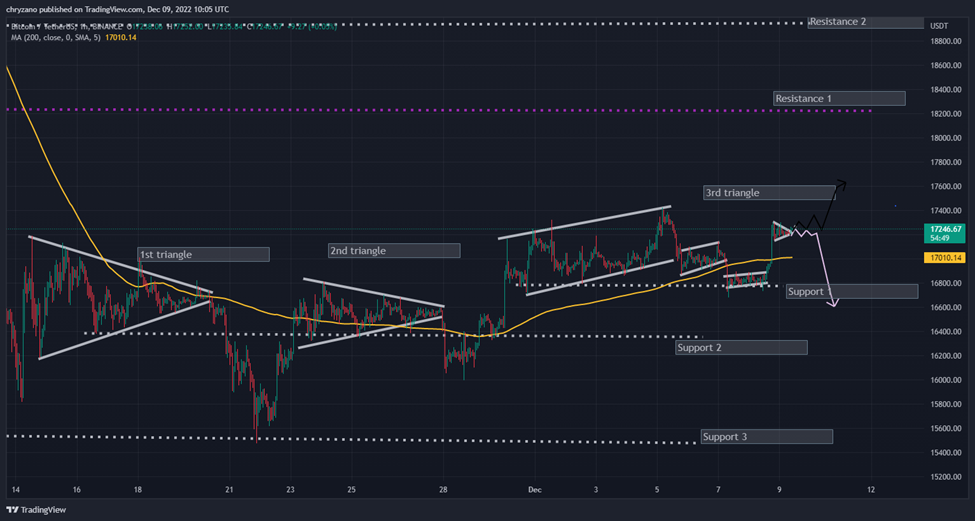
BTC formed triangles from the second half of November. Once BTC broke through the first triangle, the price of BTC dropped drastically from $16,695 to $15,468 within 24 hours.
Moreover, after BTC broke the second triangle, there was another drop in prices.
Interestingly, BTC has been trading in a bearish flag since the beginning of December. The first bearish flag had more range of vertical motion than the second bearish flag, while the third bearish flag seemed to be moving sideways. However, at the end of the third flag, BTC spiked from $16,850 to $17,289 within 24 hours.
Interestingly, BTC has been forming triangles in mid-November. Once BTC broke both triangles, its price plunged. Currently, BTC is forming a third triangle and if BTC breaks the triangle, the prices could plunge down to Support 1 ( $16,774) based on its previous behavior.
Contrastingly, if BTC were to go bullish after breaking the triangle it would target hitting Resistance 1 at $18,220.
Moreover, the Bollinger bands are contracting, which depicts that there will be less volatility in the future. Complementing the Bollinger bands’ indication of less volatility, the 200MA day is also parallel with the horizontal line; hence BTC could go sideways.
Disclaimer: The views and opinions, as well as all the information shared in this price analysis, are published in good faith. Readers must do their own research and due diligence. Any action taken by the reader is strictly at their own risk, Coin Edition and its affiliates will not be held liable for any direct or indirect damage or loss.
Disclaimer: The information presented in this article is for informational and educational purposes only. The article does not constitute financial advice or advice of any kind. Coin Edition is not responsible for any losses incurred as a result of the utilization of content, products, or services mentioned. Readers are advised to exercise caution before taking any action related to the company.
: What Happens If You Use an Unlicensed Platform?")


