


- XRP spot ETFs posted $5.34M in daily outflows on June 3, the first significant outflow since late April, with total net assets dropping to $1.03B
- EGRAG flags $0.90 to $1.30 as the key battlefield, noting June historically prints -17% to -39% in midterm years
- Futures volume fell 8.04% to $3.70B with OI down 8.70% as longs absorbed $23.30M against just $755.63K for shorts
XRP trades at $1.1736 on June 4, pressing into a macro support zone that EGRAG Crypto calls the most important structural decision point of the current cycle, as June opens below both the 50 EMA and the white macro trendline for the first time in years.
XRP Daily Chart: Descending Channel Tightens as Both SAR and Supertrend Press From Above
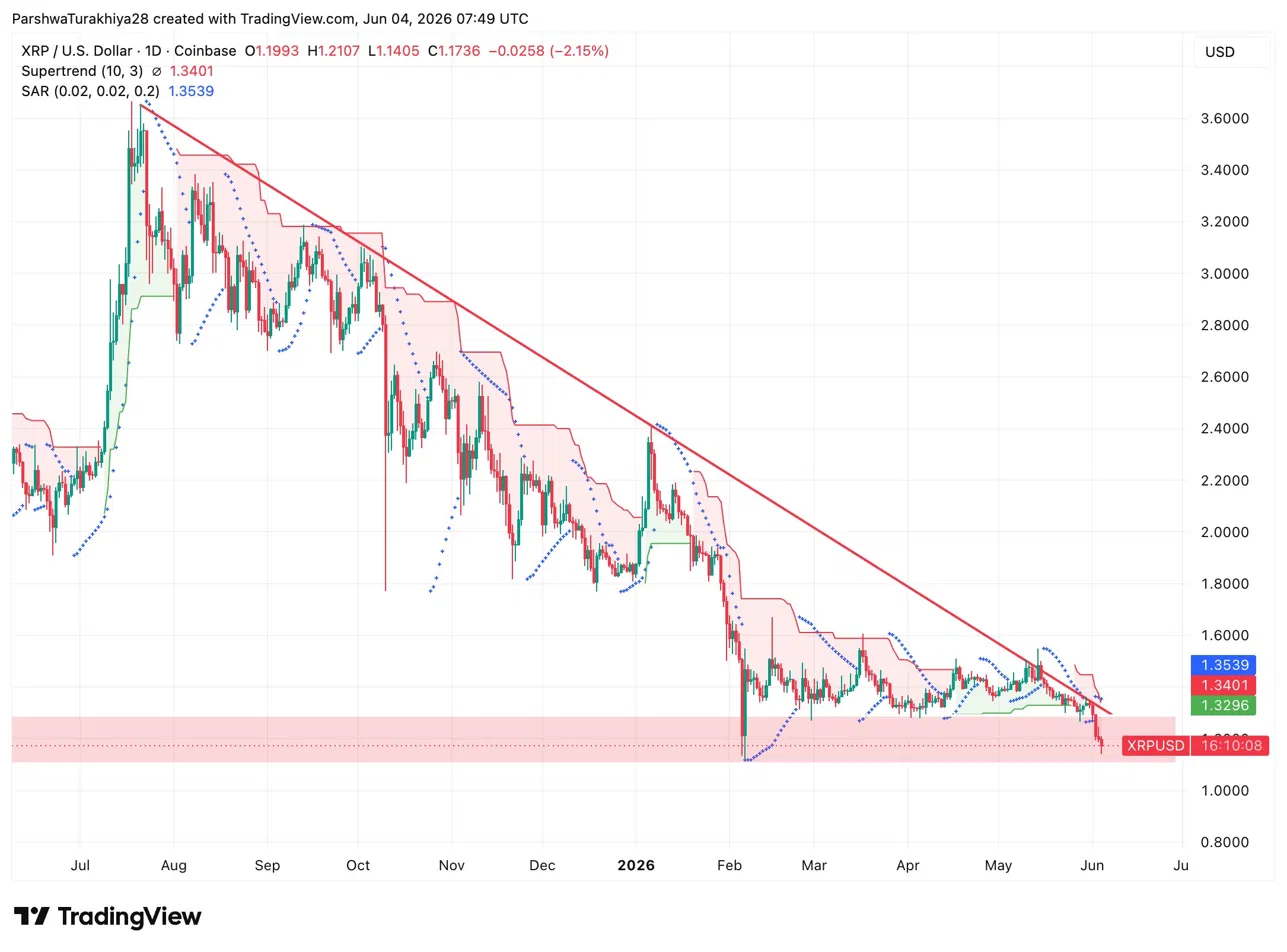
The daily chart has been printing lower highs inside a clean descending channel since the August 2025 peak near $3.60. Every recovery attempt from the February 2026 low near $1.10 has been rejected at a lower high, confirming the downtrend is intact. The Supertrend sits at $1.3401 and the SAR at $1.3539, both overhead and both pointing bearish on the daily timeframe.
Related: Worldcoin (WLD) Price Prediction 2026-2050: Will WLD Hit $1 Soon?
The pink demand zone visible between $1.10 and $1.20 has provided support twice since February. Price is currently pressing into that zone for the third time. Third tests of the same support zone historically either produce a strong bounce or break decisively. The descending channel lower trendline sits near $1.10 to $1.15, making that range the last meaningful floor before open air below $1.00. Above current price, the Supertrend at $1.3401 is the first level that needs to flip before any recovery becomes credible.
XRP Key levels for June 5:
- Resistance: $1.3401 (Supertrend), $1.3539 (SAR), $1.50 (channel midline)
- Support: $1.15 (channel lower trendline), $1.10 (demand zone low), $0.90 (EGRAG macro support)
What EGRAG’s June Analysis Actually Says
EGRAG Crypto posted a detailed macro breakdown flagging that XRP has opened June below the 50 EMA and the white macro trendline simultaneously, a setup that historically precedes the most bearish monthly closes in XRP’s history. The data is direct: June 2014 printed -17%, June 2018 printed -39%, June 2022 printed -32%. June 2026 opens in the same structural position in a midterm year.
The analyst identifies $0.90 to $1.30 as the key battlefield for the month. Below $1.30, sentiment turns heavily bearish and continuation lower becomes the path of least resistance. Above $1.30, a reclaim of the 50 EMA and the macro trendline would flip the setup into what EGRAG calls one of the biggest bear traps of the cycle. Until XRP breaks out of the yellow falling wedge, the structure favors the downside.
XRP ETF Flows: First Meaningful Outflow Since April Arrives at the Wrong Time
XRP spot ETFs recorded $5.34M in net outflows on June 3, the first significant daily outflow since late April’s $5.83M exit. Bitwise led with $4.06M out, followed by 21Shares at $589.37K and Grayscale at $699.42K. Total net assets dropped to $1.03B. Cumulative net inflows hold at $1.42B but the direction of daily flows has shifted from consistent green to red precisely as price tests the macro support zone.
Related: Hyperliquid (HYPE) Price Prediction 2026-2050: Will HYPE Hit $100 Soon?
Four of the five products showed outflows on the same day, which reflects broad-based institutional repositioning rather than a single product’s redemption event. When ETF outflows arrive at a moment of technical weakness, the two pressures compound rather than offset.
XRP Futures: Positions Closing and Longs Taking the Losses
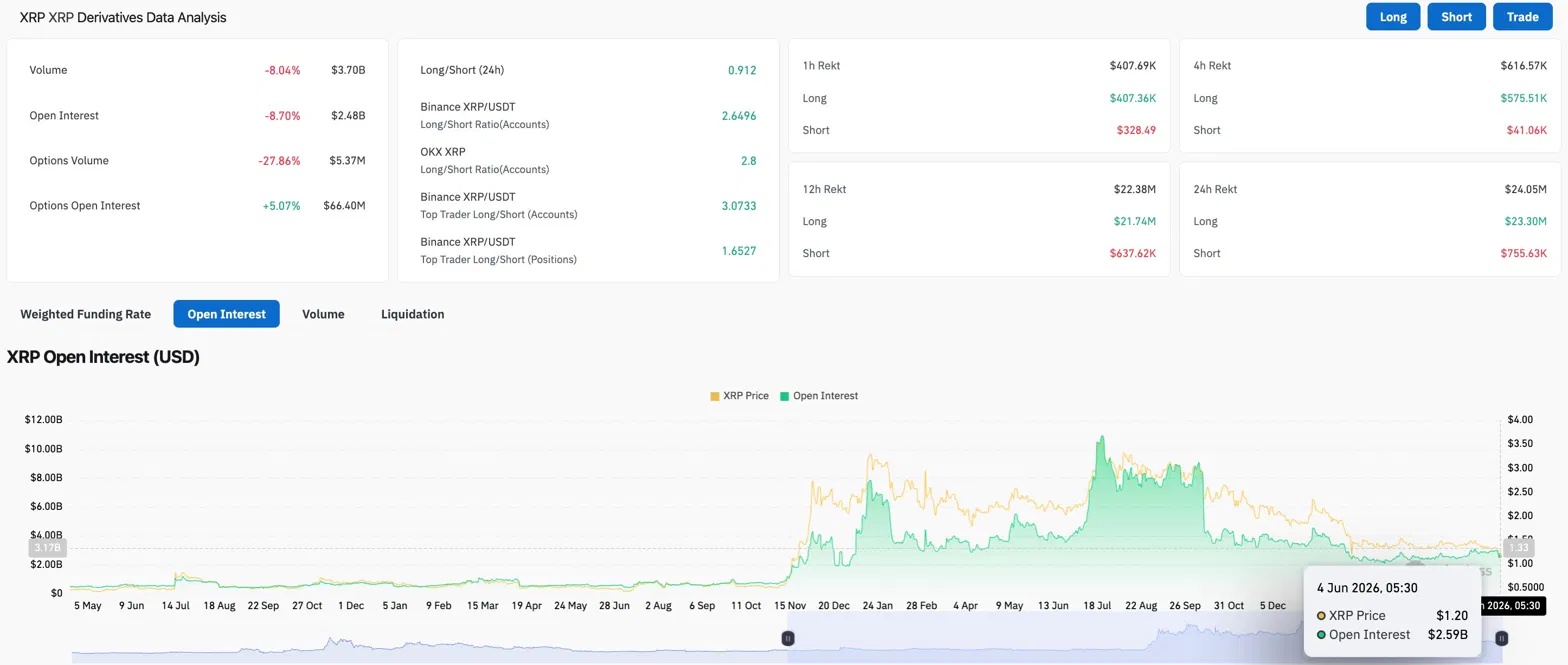
Volume fell 8.04% to $3.70B while open interest dropped 8.70% to $2.48B. Both declining together while price falls means positions are being closed into weakness rather than new shorts being built. Longs absorbed $23.30M in 24-hour liquidations against just $755.63K for shorts, a 30 to 1 ratio that reflects how heavily the retail base is positioned long against a trend that has not given them reason to hold.
The retail long/short ratio on Binance sits at 2.6496, meaning retail is still significantly net long despite the losses. Top traders are running 3.0733 by accounts but only 1.6527 by positions, suggesting professionals hold the directional long view but are sizing conservatively into a bearish month.
XRP Price Prediction for June 5
- Upside: A daily close back above $1.30 reclaims the key battlefield level EGRAG identified and shifts the setup toward a potential bear trap, with the Supertrend at $1.3401 and SAR at $1.3539 as the next targets on any recovery.
- Downside: Losing the $1.15 demand zone on a daily close opens the channel lower trendline near $1.10 to $1.12, with EGRAG’s $0.90 macro support as the broader June target if the falling wedge breaks down.
Related: Zcash (ZEC) Price Prediction 2026-2050: Will Zcash Hit $1,000 Soon?
Disclaimer: The information presented in this article is for informational and educational purposes only. The article does not constitute financial advice or advice of any kind. Coin Edition is not responsible for any losses incurred as a result of the utilization of content, products, or services mentioned. Readers are advised to exercise caution before taking any action related to the company.


