



- Bitcoin price could rebound 23.5% toward $80,000 within the weekly bearish structure.
- The broken $74,800 support and $78,581 monthly order block could cap Bitcoin’s rally.
- A rejection near $80,000 could send BTC below its $58,115 six-month low toward $57,000.
Bitcoin is back above $64,000 after briefly falling toward $62,000. The recovery is still modest, but a projection on the weekly chart suggests BTC could trade as high as $80,000 before heading toward the $57,000 region. Such a rally would take Bitcoin back into an area where sellers could re-enter the market, as the weekly structure remains bearish.
Bitcoin Price Breakdown Sets Stage for Potential $80K Recovery
Bitcoin’s troubles began after buyers failed to extend an earlier recovery beyond $87,000. Since then, the Binance BTC/USDT weekly chart on TradingView has recorded a series of lower highs, with mounting selling pressure eventually pushing the cryptocurrency below $74,800.
Much of the recent decline unfolded during a large bearish weekly candle, which drove BTC toward the $62,000 region. However, buyers subsequently recovered some of those losses, bringing Bitcoin to $64,758.55 at the time of the analysis.
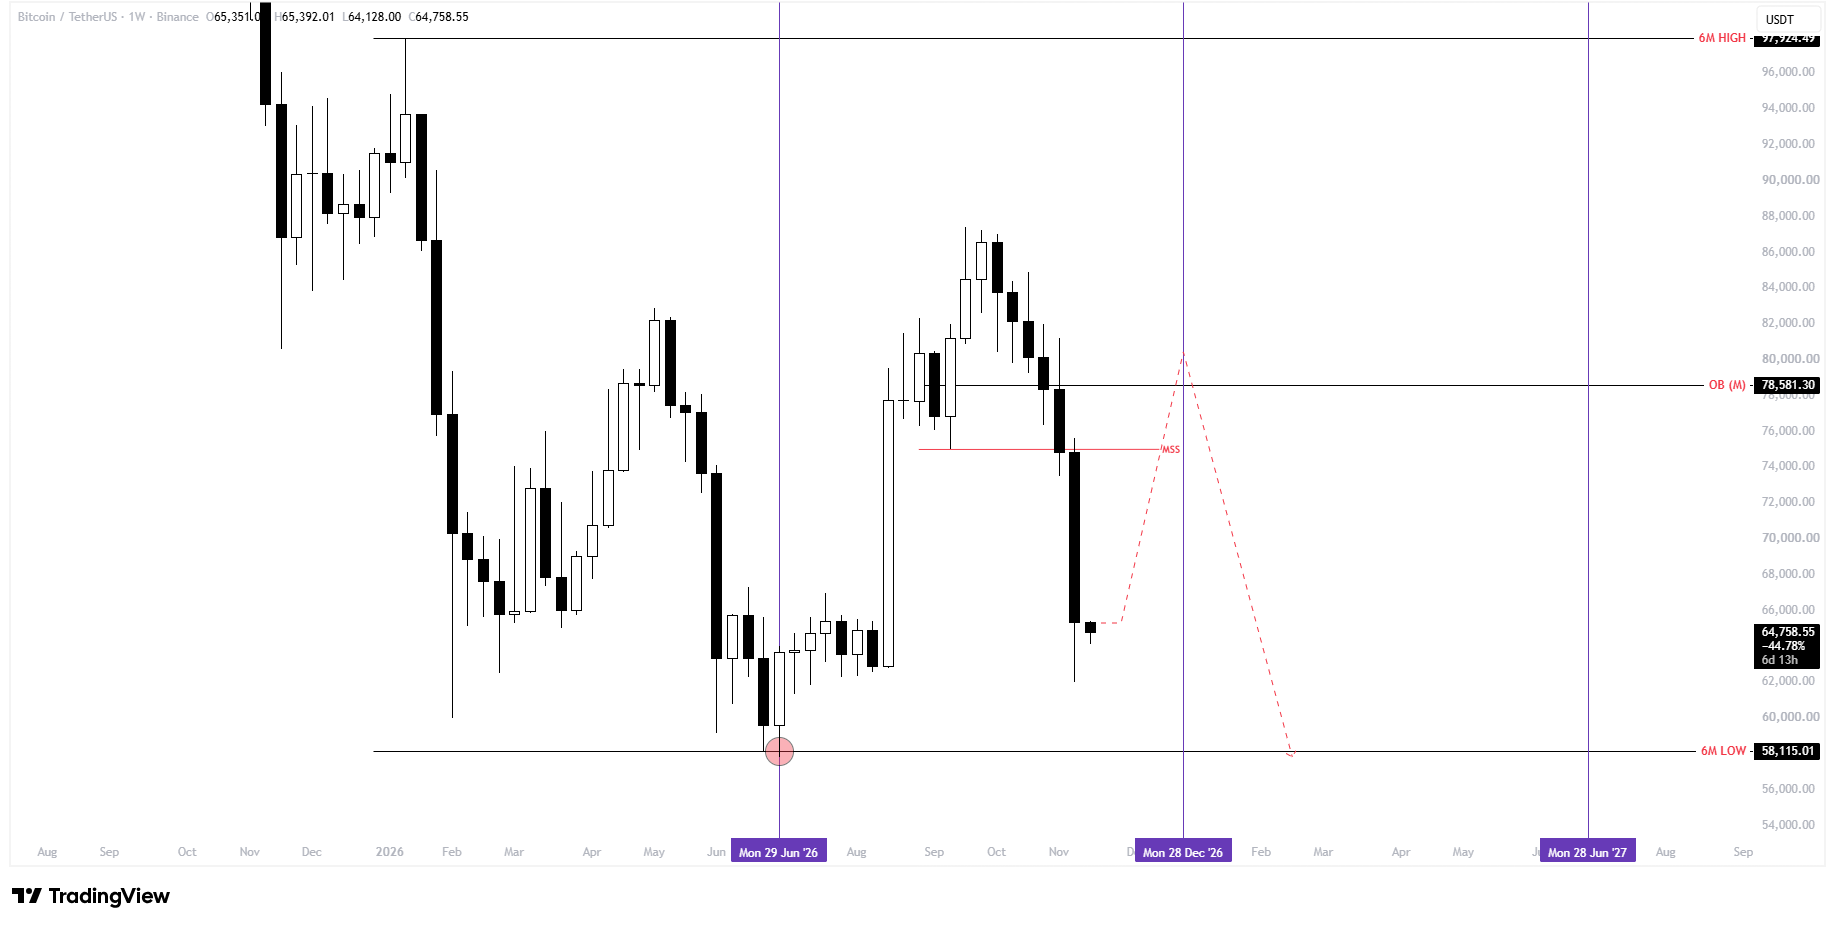
Although the recovery leaves room for a further retracement, the immediate focus remains on whether buyers can defend the $62,000 level. Should Bitcoin extend its recovery, former support around $74,800 could act as resistance, particularly as this level marks a market structure shift (MSS) on the weekly chart.
Follow us on X for real-time crypto updates.
Monthly Order Block at $78,581 Could Limit Bitcoin’s Recovery
Another level marked on the chart is $78,581.30, where a monthly order block sits just below the projected recovery target. The chart traces a possible move toward $80,000 in late December. That would put Bitcoin up about 23.5% from its displayed price, though the rally could still leave the weekly bearish structure intact.
Much depends on how BTC trades around the monthly order block. Selling in that region could produce another lower high. A break above the earlier peak near $87,000, on the other hand, would challenge the bearish projection.
Bitcoin Risks a Liquidity Sweep Below $58,115 Toward $57K
Meanwhile, the June low of $58,115.01 remains untouched. Stop-loss orders may sit beneath that level, making it a potential target for sell-side liquidity. On the chart, the projected decline begins near $80,000 and extends below the June low into early 2027.
Bitcoin would lose nearly 29% of its value over that stretch if the move reaches $57,000. There is also the possibility that BTC never reaches $80,000, as renewed selling below $62,000 could bring the June low into focus much sooner.
Bitcoin Price Resistance Levels
| Level | Significance |
| $74,800 | Broken market structure level |
| $78,581 | Monthly bearish order block |
| $80,000 | Projected relief rally target |
| $87,000 | Previous swing high |
Bullish Case
Reclaiming $74,800 could support Bitcoin’s price recovery toward $78,581 and $80,000.
Bearish Case
However, rejection near $80,000 could expose $58,115 and subsequently $57,000.
Neutral Case
Meanwhile, Bitcoin could consolidate between $62,000 and $74,800 without a decisive breakout in the short term.
FAQs
Yes, provided buyers reclaim $74,800 and overcome monthly resistance.
The monthly order block at $78,581 represents key resistance.
Yes, rejection near $80,000 could trigger a downside liquidity sweep.
A sustained breakout above $87,000 could undermine the bearish structure.
Subscribe to our YouTube channel for the latest crypto news.
Related: ASTER Price Rebounds After 26% Crash as CEO Probes Suspicious Liquidations
Disclaimer: The information presented in this article is for informational and educational purposes only. The article does not constitute financial advice or advice of any kind. Coin Edition is not responsible for any losses incurred as a result of the utilization of content, products, or services mentioned. Readers are advised to exercise caution before taking any action related to the company.