



- Bitcoin’s bullish hourly MSS puts $78,804 resistance before the $81,971 liquidity target.
- BTC must hold the $77,900–$78,000 support band to preserve its bullish hourly structure.
- Kalshi priced a Democratic congressional sweep near 71%, while Polymarket showed 72%.
Bitcoin traded near $78,222 on the supplied Binance hourly chart after the October 30 sell-off. A bullish market structure shift brought $78,804 into focus, with $81,971 a higher objective. The price analysis arrived as prediction markets favored a Democratic congressional sweep ahead of Tuesday’s November 3 U.S. midterms. However, neither market provided evidence of politically driven BTC purchases.
| Indicator | Value |
| BTC Chart Price | $78,222 |
| Hourly Signal | Bullish MSS |
| First Upside Target | $78,804 |
| External Liquidity Target | $81,971 |
| Democratic Sweep Odds | 71%–73% |
Bitcoin’s Bullish MSS Sets $78,804 as First Test Toward $81,971
Bitcoin rebounded after a drop toward $76,000 on October 30. BTC then printed higher short-term lows and interrupted its previous declining sequence. On the chart, price analysis identified a bullish market structure shift near $78,100.
A green support band between $77,900 and $78,000 became a test of that shift. That price analysis places $78,804 at internal range liquidity, where recovering momentum faces its next charted hurdle.
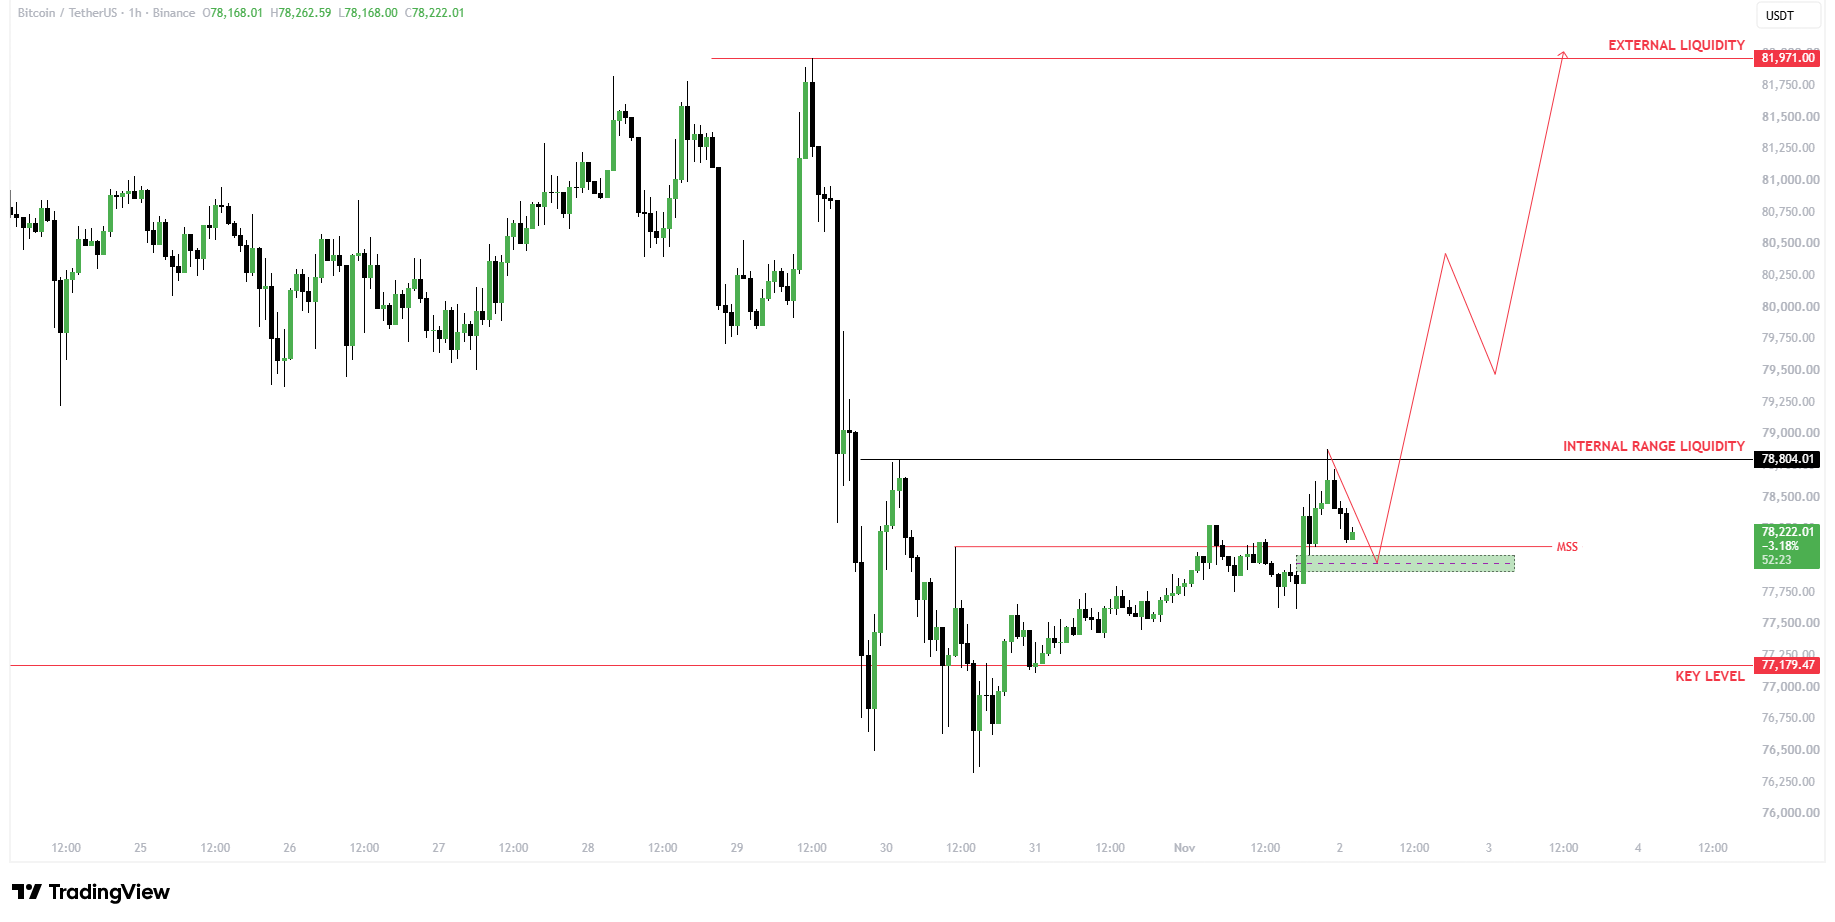
Beyond that level, $80,000 precedes external liquidity at $81,971. However, BTC remained below the first objective in the supplied snapshot. The same price analysis identifies $77,179 as a downside reference if support breaks. Those levels define near-term boundaries.
Democratic Sweep Odds Near 70% Before November 3 Midterms
Meanwhile, political expectations shifted ahead of the November 3 midterms. Kalshi put a Democratic takeover of both chambers near 71% on November 2, while Polymarket’s comparable contract stood near 72%, up five percentage points over the preceding week.
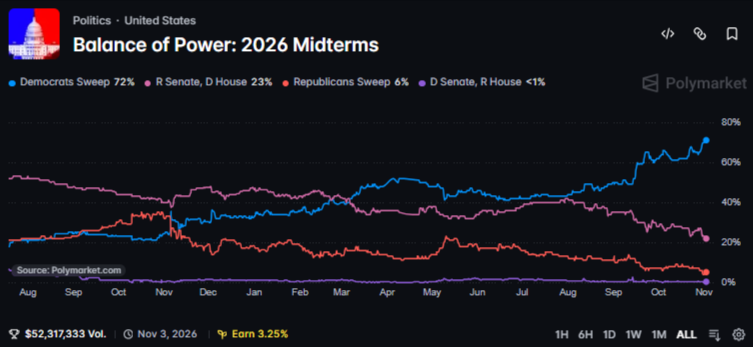
Those figures, however, reflect implied probabilities, not election results. Despite Bitcoin’s recovery, neither market identifies BTC buyers or proves political positioning. Nevertheless, congressional control can influence cryptocurrency oversight.
Democratic committee leaders could prioritize investigations and consumer protections instead of industry-backed legislation, including the stalled CLARITY Act. That distinction matters for price analysis.
Meanwhile, a survey of 301 investors found 71% expected Bitcoin below its late-September reference price under Democratic control. However, the unweighted poll measured longer-term expectations, not confirmed trading behavior.
Follow us on X for real-time crypto updates.
Binance Fallout Adds Pressure as BTC Defends Hourly Support
The rebound also occurred after a reported $6.3 billion Binance theft, which preceded a six-week Bitcoin low. The exchange recorded $3.64 billion in net withdrawals after reopening.
Those figures add market context, but price analysis alone cannot isolate their influence on BTC buying, selling, or liquidity. U.S. employment releases and central-bank decisions were also on the calendar. As a result, price analysis faces several concurrent developments rather than one verified catalyst.
With Bitcoin above highlighted support in the chart snapshot, BTC still traded below $78,804. The chart therefore leaves $77,900–$78,000 support, $78,804 resistance, and $81,971 external liquidity as reference levels. As a result, direction remained unconfirmed before voting.
Key Bitcoin Price Levels
| Price Level | Technical Significance |
| $81,971 | External liquidity target |
| $80,000 | Psychological resistance |
| $78,804 | Internal liquidity resistance |
| $78,100 | Bullish MSS reference |
| $77,900–$78,000 | Immediate support zone |
| $77,179 | Downside reference |
Bullish Case
Holding $77,900–$78,000 and clearing $78,804 could open a move toward $80,000 and $81,971.
Bearish Case
Losing MSS support would weaken BTC’s bullish momentum and expose the $77,179 downside reference.
FAQs
$78,804 comes first, followed by $80,000 and $81,971.
The hourly chart shows a break above the previous short-term swing structure.
The $77,900–$78,000 zone supports the bullish recovery.
No direct causal connection has been established.
Subscribe to our YouTube channel for the latest crypto news.
Related: Ethereum Price Prediction November 2026: Can ETH Reach $2,415 or Fall to $2,170 in November?
Disclaimer: The information presented in this article is for informational and educational purposes only. The article does not constitute financial advice or advice of any kind. Coin Edition is not responsible for any losses incurred as a result of the utilization of content, products, or services mentioned. Readers are advised to exercise caution before taking any action related to the company.