

- The CoinGlass chart shows $43M in unfilled bids clustered at $74,700–$80,000.
- BTC rebounded from $81,263 to $83,815, placing the $87,256 weekly high in focus.
- Liquidations reached $811.17M across 169,746 traders, with longs accounting for $685.65M.
Bitcoin rebounded above $83,000 after falling below $81,000 during Asian trading on October 13, renewing attention on liquidity near $87,000.
| CHART PRICE | FOUR-HOUR SIGNAL | REPORTED BIDS | UPSIDE REFERENCE |
| $83,815 | Rebound from $81,263 | $43M unfilled | $87,256 |
Asian-Session Recovery Refocuses the Weekly High
The four-hour Bybit chart showed BTC near $83,815 after rebounding from $81,263 and reclaiming the $82,539 weekly range low. This recovery followed strong buying momentum during the Asian session, bringing the broader market structure back into focus.
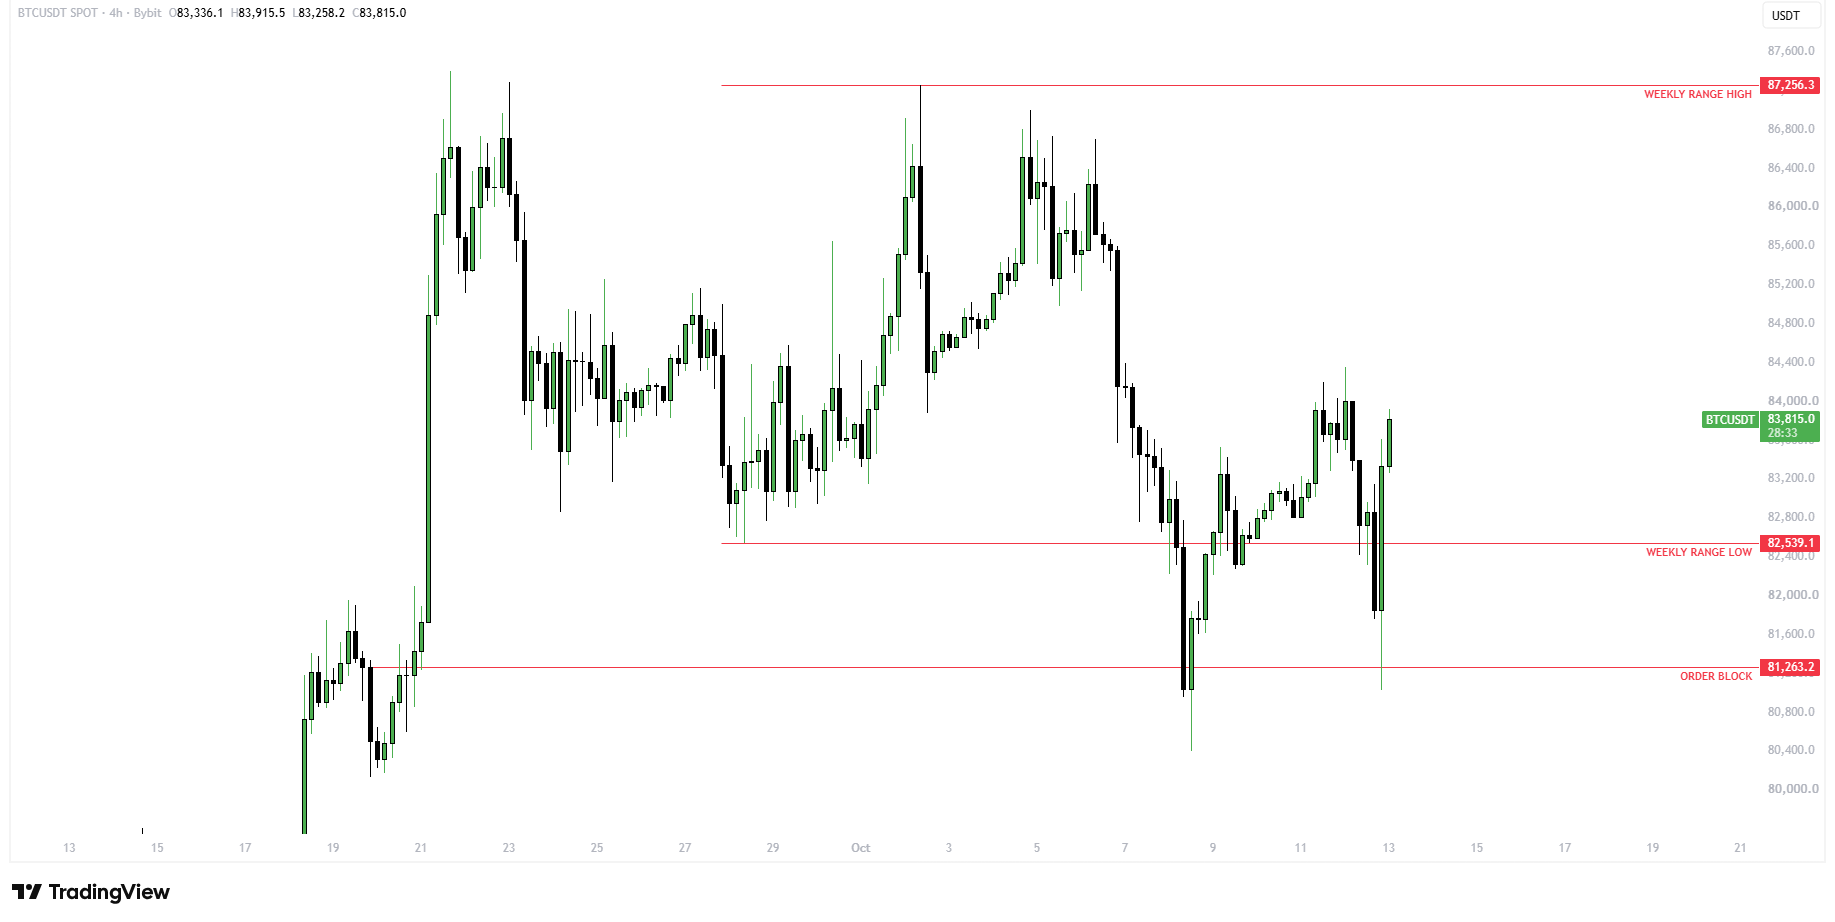
Meanwhile, the daily chart traces a bullish advance from $57,759 in June to $87,385 in September. However, repeated rejections near October’s highs indicate that another breakout remains unconfirmed.
Reported Whale Bids Raise Questions About Lower Liquidity
Against this backdrop, CoinGlass data highlights approximately $43 million in reported unfilled Bitcoin buy orders clustered between $74,700 and $80,000. This concentration indicates potential buying interest below current market prices, placing the region in focus as a possible demand zone.
However, these bids represent outstanding limit orders rather than completed transactions. Since traders can withdraw them before execution, their presence does not guarantee buying activity if Bitcoin revisits the range.
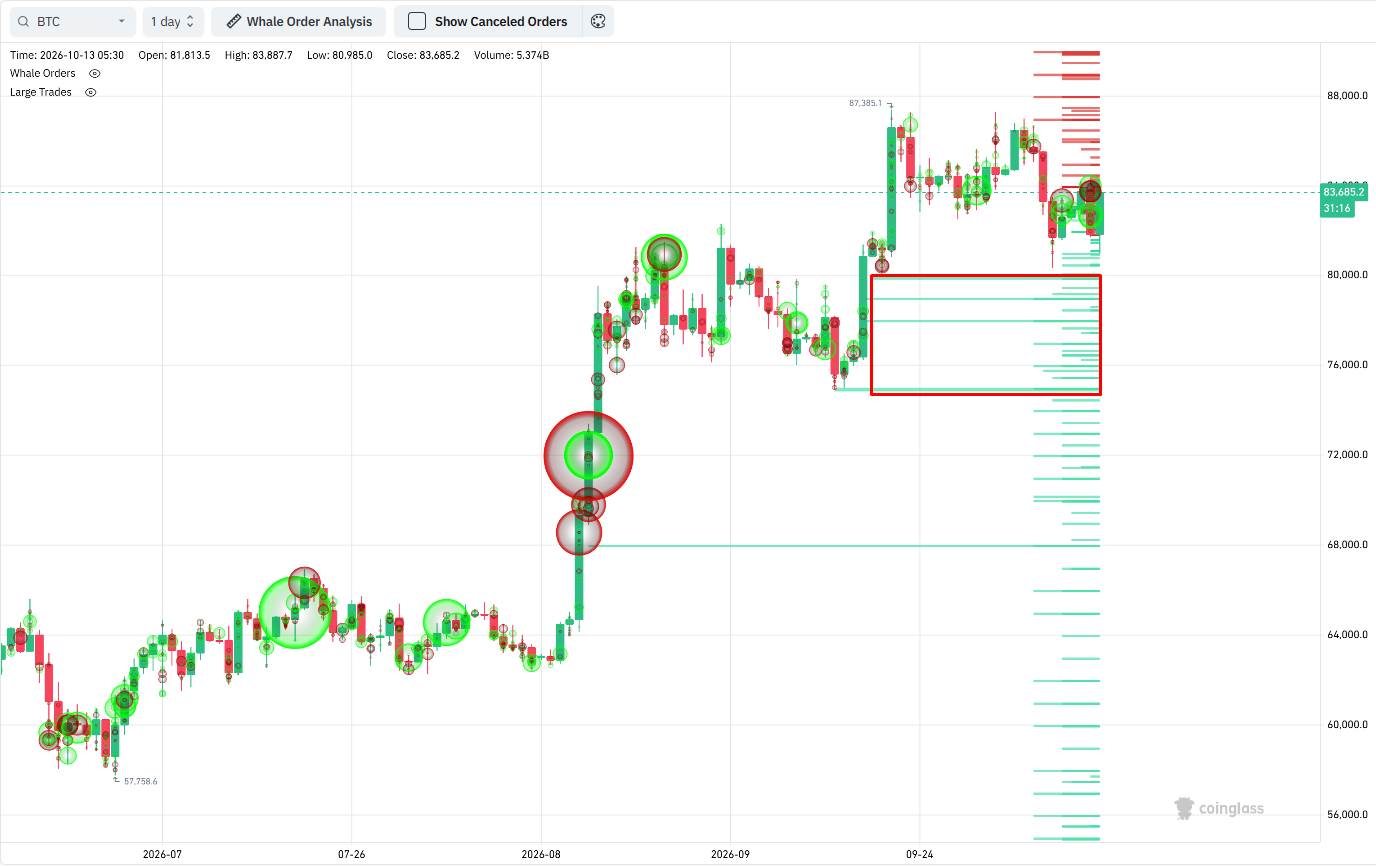
This uncertainty has fueled the whale-trap theory, which suggests large holders could encourage panic selling to accumulate assets at lower prices. They could then benefit from a subsequent recovery toward higher liquidity levels. However, neither the order-book chart nor liquidation data provides evidence of coordinated market manipulation.
Liquidations Underline the Two-Way Price Reversal
The whale-trap debate follows substantial market liquidations during Tuesday’s selloff and subsequent recovery. According to reports, the initial decline coincided with losses in South Korean semiconductor stocks and weaker U.S. technology futures.
Meanwhile, CoinGlass figures showed approximately $811.17 million in liquidations across ten exchanges over 24 hours. Of that total, long positions accounted for $685.65 million, representing 84.5% of liquidations, while 169,746 traders were affected.
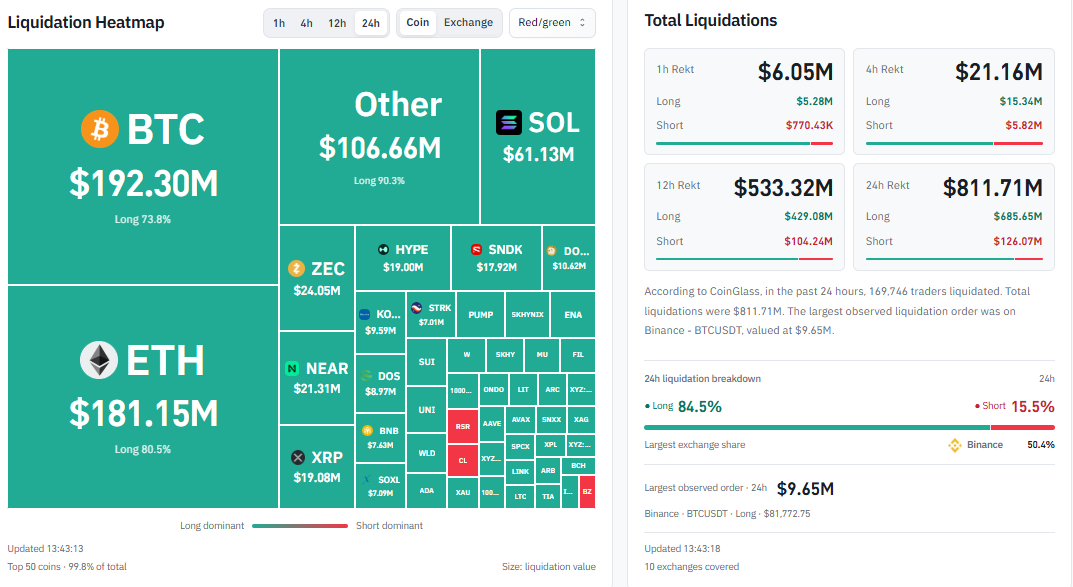
Bitcoin alone recorded $192.30 million in liquidations, with long positions accounting for 73.8% of the total. Meanwhile, four-hour liquidations reached $21.16 million, including $15.34 million in longs and $5.82 million in shorts. The largest liquidation recorded over 24 hours was a $9.65 million BTCUSDT long position on Binance.
Together, these figures highlight the impact of leveraged selling during the market downturn. However, they do not establish that whales deliberately triggered the decline or coordinated the reported buying activity.
Levels That Decide the $87K Test
| LEVEL | ROLE IN THE COMING SESSIONS |
| $87,256 | Weekly high and upside liquidity reference |
| $84,000–$85,600 | First resistance zone |
| $82,539 | Reclaimed weekly low; immediate pivot |
| $81,263 | Order block if the pivot fails |
| $74,700–$80,000 | Reported bids, subject to cancellation |
EXPANSION CASE
BTC holding $82,539 and breaking $84,000–$85,600 would put $87,256 in focus. However, liquidity above $87,000 remains a reference, not a guaranteed destination.
FAILURE CASE
Meanwhile, losing $82,539 would expose $81,263. A deeper decline could further approach the reported bids only if those orders remain active.
BOTTOM LINE
Overall, Bitcoin’s rebound and the wave of liquidations highlight heightened market volatility. However, available data does not establish that whales deliberately triggered panic selling or executed the reported $43 million in buy orders.
FAQs
The $87,256 weekly high remains the main upside reference, provided buyers overcome resistance between $84,000 and $85,600.
The reclaimed $82,539 weekly range low serves as immediate support, while a breakdown would expose the $81,263 order block.
The reported unfilled bids between $74,700 and $80,000 indicate potential demand, although their aggregate value remains independently unverified.
Reported lower buy orders and substantial long liquidations have fueled the theory, but neither establishes coordinated whale manipulation.
Disclaimer: The information presented in this article is for informational and educational purposes only. The article does not constitute financial advice or advice of any kind. Coin Edition is not responsible for any losses incurred as a result of the utilization of content, products, or services mentioned. Readers are advised to exercise caution before taking any action related to the company.