






- Bitcoin is consolidating near the $63K range after a volatile start to the week.
- Analysts note key resistance clusters at $64K–65K, while support zones remain around $61K–60.5K.
- Weekly charts show bullish divergence in major support areas as short-term technicals indicate cautious optimism.
Bitcoin has entered the third quarter with a mixed start. The daily charts show a consolidation phase near $63K, reflecting uncertainty about market momentum after a weak start to the week. Analysts observe that while short-term buyers have attempted a recovery, liquidity is concentrated in key areas that could dictate the next directional move.
Notably, the weekly chart indicates a bullish divergence in a massive support zone, suggesting that long-term market structures may be primed for a potential recovery.
Historically, similar conditions have preceded periods of measured gains, although analysts emphasize that confirmation will depend on whether BTC holds above the $61K support level.
Resistance and Liquidity Clusters
Market experts point to resistance clusters between $64K and $65K as critical barriers for Q3 gains. A sustained move above this range could attract additional buying interest, while failure to breach the zone may result in sideways or retracement movement.
On the downside, support is concentrated near $61K–60.5K, followed by secondary clusters at $59K and $57.5K. Analysts note that these levels are crucial for preserving the current weekly structure, with failure likely to trigger deeper retracement phases.
Short-term indicators, including 4-hour EMAs, suggest price remains fragile, reinforcing the importance of these support zones.
Related: Strategy Sells 3,588 BTC for $216 Million to Funds Dividends
Technical Indicators Suggest Cautious Optimism
Meanwhile, MACD readings on daily charts show narrowing bearish momentum, while RSI levels hover around neutral territory, indicating equilibrium between buyers and sellers. Analysts highlight that while buyers are not aggressively stepping in, gradual accumulation is occurring in key support zones.
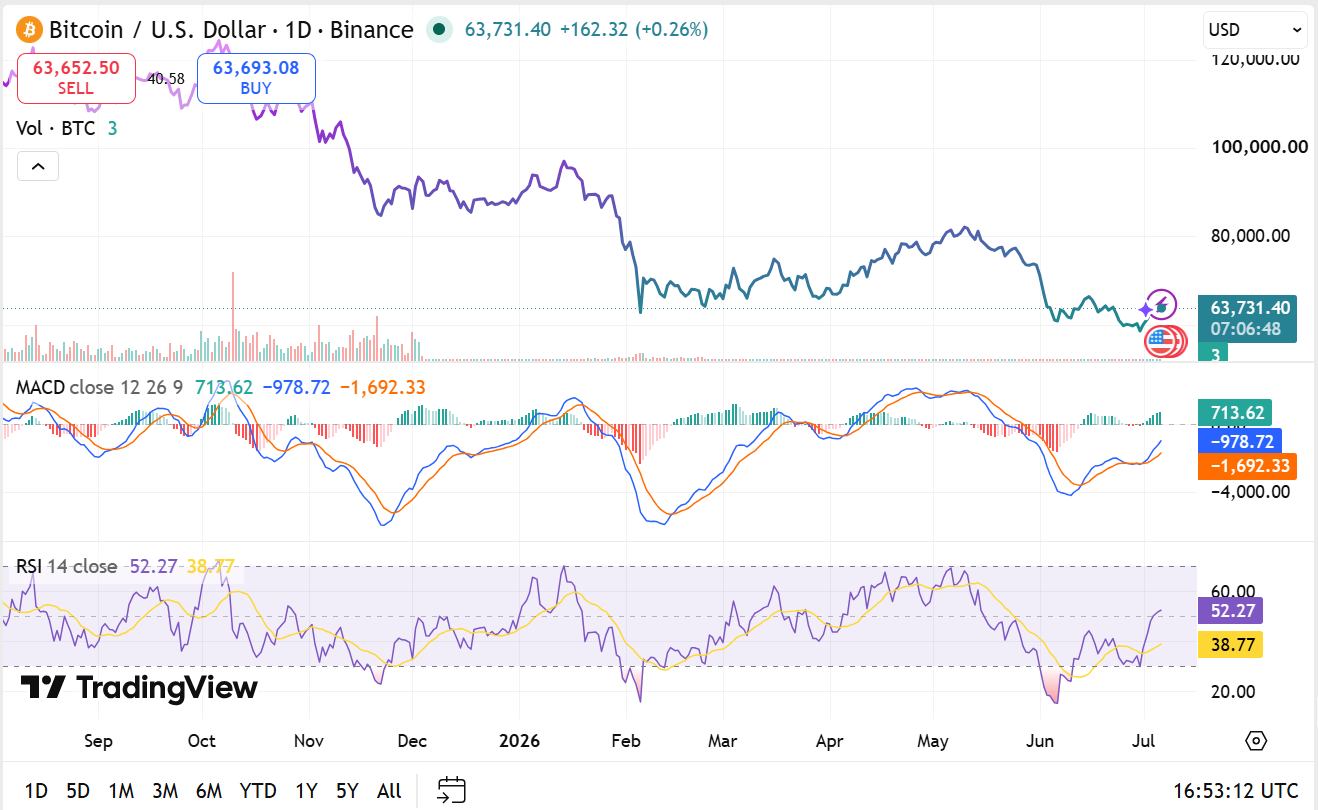
This consolidation phase implies that BTC may be preparing for a test of higher resistance levels later in Q3. Traders and market watchers are closely monitoring both volume patterns and liquidity distribution to gauge potential breakout or pullback scenarios.
Bitcoin remains positioned near key technical levels, with short-term indicators hinting at cautious optimism.
While the overall trend is undecided, the presence of strong support zones and bullish divergence suggests that the market could favor measured upward moves if resistance clusters are successfully challenged.
Disclaimer: The information presented in this article is for informational and educational purposes only. The article does not constitute financial advice or advice of any kind. Coin Edition is not responsible for any losses incurred as a result of the utilization of content, products, or services mentioned. Readers are advised to exercise caution before taking any action related to the company.




