





- XRP trades at $1.0022 on August 17, up 0.97%, recovering above $1 after last week’s breach with all four EMAs still overhead
- The monthly RSI has fallen to its lowest level in years, a condition that has never came in years.
- XRP Ledger hit 49,929 active addresses in a single 24-hour span, its highest in over two months, even as crowd sentiment hit a 3-month bearish extreme
The XRP price prediction is leaning on one of the more reliable bottom signals in the token’s history right now, with the monthly RSI dropping to its lowest reading in years just as XRP claws back above $1 after last week’s brief breach.
XRP Price Analysis: $1 Is the Line and the Descending Trendline Is Just Above
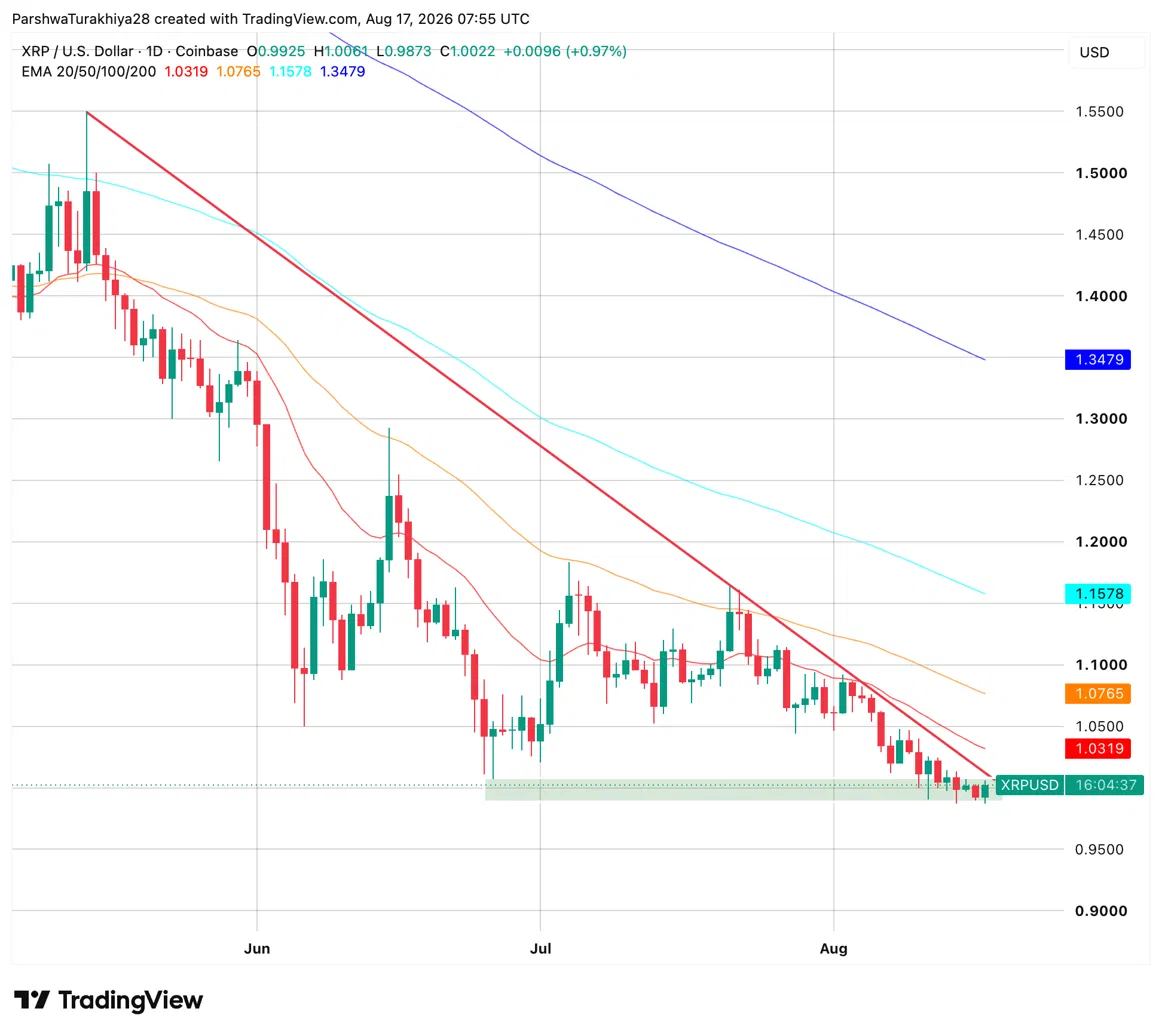
XRP is back above $1 after last week’s dips below the round number, with today’s session opening at $0.9925, pushing to $1.0061, and holding at $1.0022. The green support zone just below $1 has been defended repeatedly, but the descending trendline from May continues to slope through $1.03 to $1.05, making that the immediate ceiling any recovery needs to clear.
All four EMAs slope downward above price. The 20-day at $1.0319 is the first level to reclaim, followed by the 50-day at $1.0765, the 100-day at $1.1578, and the 200-day at $1.3479. Each has acted as resistance at some point this summer. Below, $1 and the support zone are the only things standing between current price and $0.95.
Related: Chainlink Price Prediction: Is LINK’s Push to $9.50 the Start of a Run to $20?
Monthly RSI at 40.17 has fallen to its lowest reading in years, a condition that has not been visible in years. The gap between the current RSI and its signal line at 52.27 has historically been the setup that preceded XRP’s largest moves.
XRP Support and Resistance Levels, August 17, 2026
| Type | Price | Level |
| Resistance | $1.03 to $1.05 | Descending trendline |
| Resistance | $1.0765 | 50-day EMA |
| Resistance | $1.1578 | 100-day EMA |
| Support | $1.00 | Round number and repeated test level |
| Support | $0.9873 | Session low and green support zone |
| Support | $0.95 | Next floor if $1 breaks on daily close |
XRP Analysis: Fear at a 3-Month High, On-Chain Activity at a 2-Month High
Santiment flagged a striking divergence in XRP last week. Crowd commentary across X, Reddit, and Telegram hit a three-month bearish extreme as prices failed to recover above $1. At the same time, the XRP Ledger recorded 49,929 active addresses in a single 24-hour span, its highest activity level in over two months, after July activity had dropped near 2026 lows.
That combination is the setup contrarian bulls look for. When sentiment is at its most negative and on-chain participation is rising, it typically means real users and holders are actively engaging with the network regardless of price, while the loudest voices are the ones who have already sold or never held. Santiment’s framing was direct: fear is loud, participation is rising, and if XRP holds structure and demand returns, the current negativity could become tomorrow’s discounted entry narrative.
XRP Derivatives: Longs Absorbing the Pain as Volume Surges
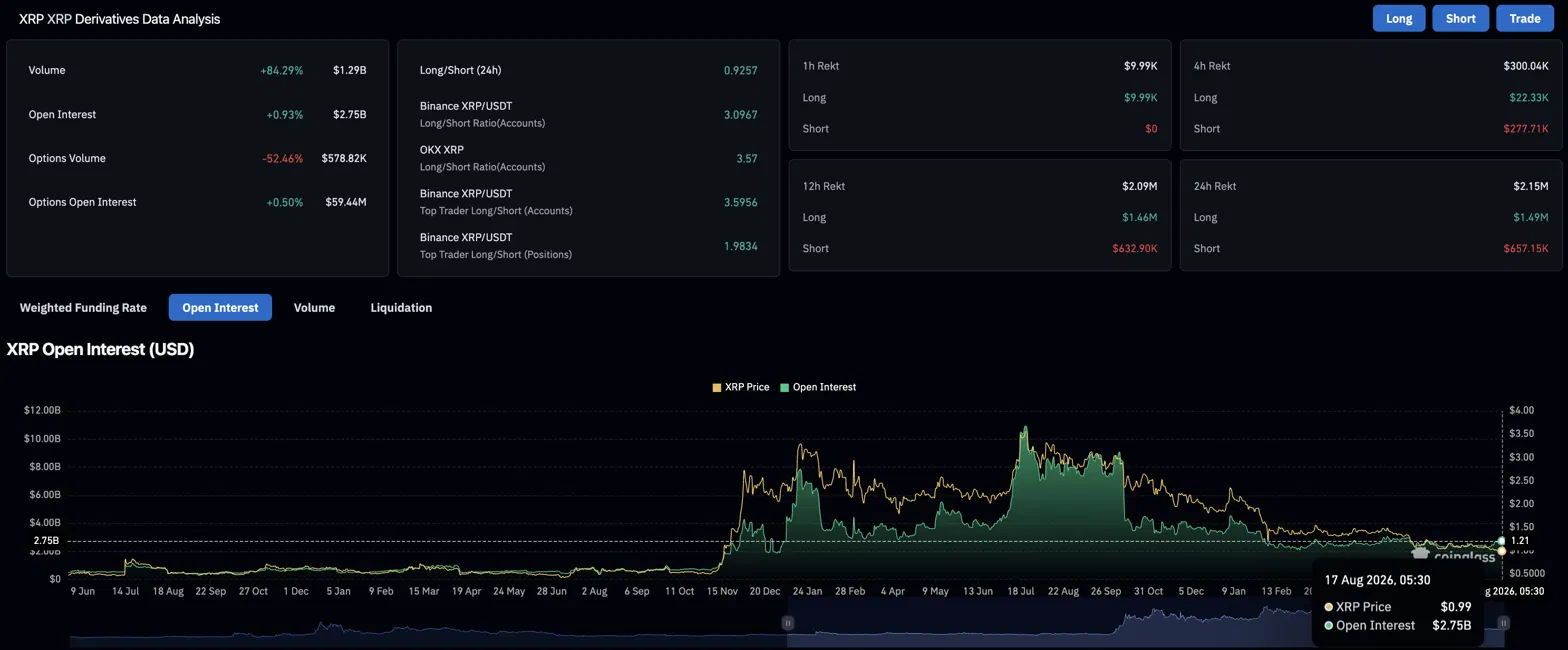
Trading activity picked up sharply with volume surging 84.29% to $1.29B, while open interest rose 0.93% to $2.75B, meaning fresh money is entering the market rather than existing traders simply switching sides. The $1 level is clearly drawing attention.
Despite the overall ratio leaning slightly short at 0.9257, the more informed accounts are positioned the opposite way. Binance retail sits at 3.09, OKX at 3.57, and top trader accounts at 3.5956, all heavily net long, with larger position sizes confirming the conviction at 1.9834.
Liquidations tell the real story though. Of the $2.15M liquidated over 24 hours, longs absorbed $1.49M while shorts lost just $657.15K. The buyers defending $1 are currently taking the larger share of the pain, which means this level needs to hold soon or those long positions start becoming the next wave of selling pressure.
| Metric | Value | Interpretation |
| 24h Volume | $1.29B (+84.29%) | Sharp rise in activity around $1 test |
| Open Interest | $2.75B (+0.93%) | Fresh positions being added |
| Top Trader L/S (Positions) | 1.9834 | Large accounts heavily net long |
| 24h Liquidations | $2.15M | Longs absorbed the majority of pain |
XRP Price Prediction: Upside and Downside Targets
Bullish Case, Target: $1.0765 (50-day EMA)
XRP holds $1 on a daily close and the descending trendline at $1.03 to $1.05 breaks to the upside, with the monthly RSI’s multi-year low acting as a historical bottom signal. On-chain activity sustaining above 40,000 active addresses confirms real participation behind the recovery, and FOMC minutes on Wednesday August 19 come in less hawkish than feared, supporting risk assets. Price pushes through the 20-day EMA at $1.0319 toward the 50-day at $1.0765.
Bearish Case, Risk Level: $0.95
The $1 support breaks again on a daily close as the descending trendline continues to cap every recovery attempt. FOMC minutes reveal a hawkish tone and September hike odds push back above 50%, pulling risk assets lower. The longs absorbing pain at current levels hit their stop losses and the selling accelerates toward $0.95 as the next meaningful floor below the 2024 accumulation zone.
Conclusion
XRP’s setup right now is unusual because the loudest signal, crowd sentiment at a three-month low, is pointing the opposite direction from three quieter ones: rising on-chain activity, a multi-year RSI low, and long positions absorbing most of today’s liquidations.
Historically, that kind of split has favored the quieter signals over the loud one, which is exactly the pattern Santiment flagged and the one that showed up before XRP’s two largest historical rallies. None of that guarantees $1 holds this time. The level still has to prove itself through Wednesday’s FOMC minutes, and a failure here would put those same long positions at risk of becoming forced sellers rather than supportive buyers.
Related: Portal Price Prediction: PORTAL Holds Bullish Structure as Profit-Taking Risk Rises
FAQs
XRP trades at $1.0022 after reclaiming $1. The bullish target is $1.0765 (50-day EMA); the bearish risk level is $0.95 if $1 fails again on a daily close.
It’s fallen to its lowest level in years, a reading that preceded both the 2020 run to $1.96 and the 2022-to-2023 base before XRP’s recovery to $3.40, making it one of the more reliable long-term bottom signals in XRP’s history.
The XRP Ledger hit 49,929 active addresses in 24 hours, a two-month high, even as social sentiment hit a three-month low. That divergence typically signals real holders staying engaged while the loudest bearish voices have already sold.
$1, the round number XRP has repeatedly defended over the past week, with the support zone near $0.9873 as the last line before a slide toward $0.95.
XRP is showing a rare combination of a multi-year RSI low, rising on-chain activity, and heavy long positioning from larger accounts, but $1 has already failed once this month and FOMC minutes add real near-term risk. This is not financial advice, so weigh the bullish and bearish cases above against your own research.
Disclaimer: The information presented in this article is for informational and educational purposes only. The article does not constitute financial advice or advice of any kind. Coin Edition is not responsible for any losses incurred as a result of the utilization of content, products, or services mentioned. Readers are advised to exercise caution before taking any action related to the company.




