

- Bitcoin held above $81,200 but remained below the $81,497.33 resistance level.
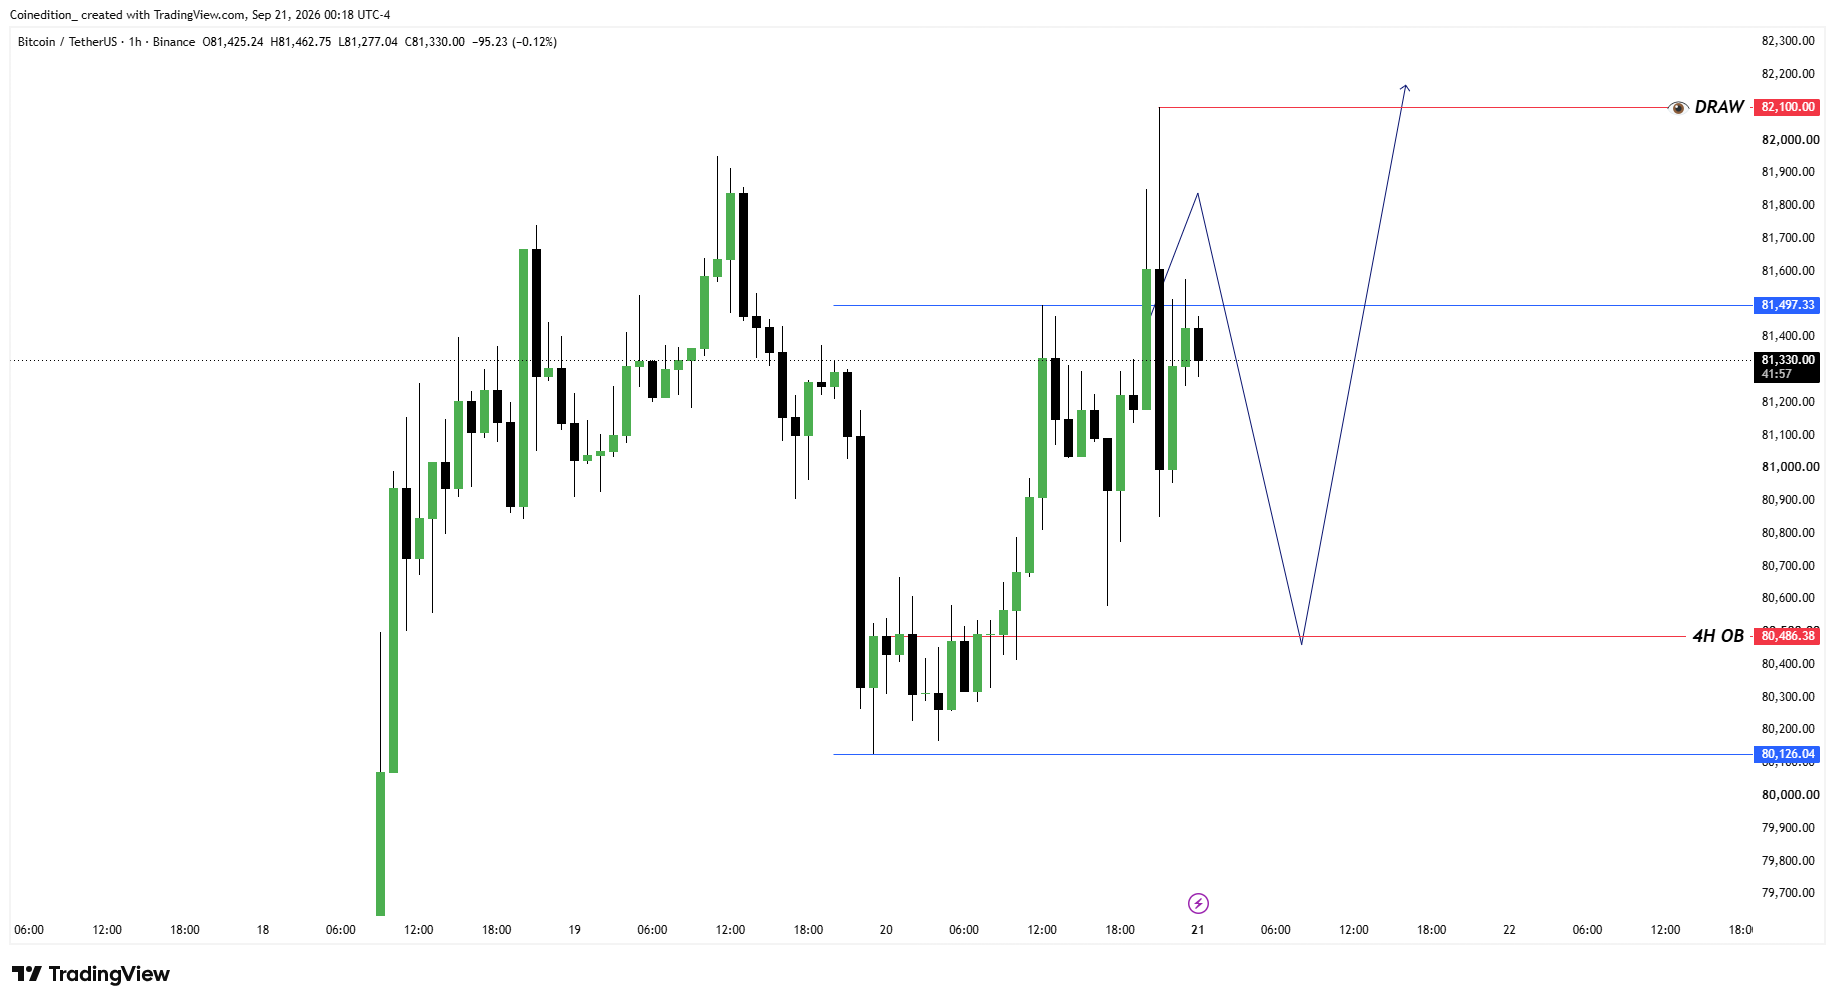
- Holding the $80,486 order block could support another Bitcoin test of $82,100.
- A four-hour close below $80,486 would put the $80,126.04 support level in focus.
| Chart Price | Key Support | Immediate Resistance | Upside Target |
| $81,615 | $80,486 | $81,497 | $82,100 |
Bitcoin traded above $81,615 at the time of writing as its recovery approached resistance, bringing a possible pullback toward the $80,486 four-hour order block into focus. The chart’s projected path outlined a possible rebound toward $82,100 after that retest. However, the setup remained conditional, with BTC still below $81,497.33 and buyers yet to sustain a breakout above that level.
The $80,486.38 order block anchors the projected recovery. Holding this support would preserve the setup, while a four-hour close below it would invalidate the immediate bullish outlook.
September 20 Liquidity Sweep Pushes Bitcoin Back Inside the Range
The accompanying market account described September 20 trading as a liquidity sweep that pushed Bitcoin back inside its normal range before a rebound.
By September 21, the four-hour Binance chart showed BTC at $81,250 after recovering from below $80,200. The previous candle was down 0.22%, indicating that the rebound had encountered renewed selling.
The hourly chart showed a similar pause at $81,330, down by 0.12% during the latest candle. Both snapshots placed Bitcoin beneath the same $81,497.33 resistance.
Source: TradingView
Four-Hour Close Supports a Sweep of the $80,486 Order Block
The projected sequence begins with an advance toward $81,800, followed by a pullback into the order block at $80,486.38. A subsequent rebound would bring $82,100 back into focus.
The chart descriptions, however, did not confirm a completed four-hour close supporting that entire sequence. The proposed sweep therefore remained a scenario awaiting confirmation.
An earlier wick had already reached $82,100 before Bitcoin reclaimed those gains. That rejection left the previous high as an upside reference while directing attention toward support beneath the market.
Can the $80,486 Order Block Restart Bitcoin’s Bullish Move?
A rebound from the order block would require more than a brief touch of the marked level to satisfy the outlined setup. The confirmation criteria include a market structure shift on the 15-minute or hourly chart, followed by a strong upward move that creates a bullish fair value gap.
Holding that gap during a follow-up retest would support the proposed continuation. Until those signals appear, the chart does not establish that the anticipated recovery has started.
London or New York Session Could Deliver the Reversal
The analysis identifies the opening 90 minutes of the London and New York sessions as potential windows for those signals.
Its proposed sequence involves an initial move into support, followed by an upward structural shift. However, the timing remains conditional: neither session opening confirms that Bitcoin will revisit the block or reverse from it.
The price response would determine whether the session delivers the projected setup.
Key Levels
- Four-hour order block: $80,486.38.
- Next marked support: $80,126.04.
- Immediate resistance: $81,497.33.
- Intermediate projected level: $81,800.
- Main upside target: $82,100.
A successful support retest, followed by a period of trading above $81,497.33, would strengthen the case for another attempt at $82,100. In addition, a four-hour close below $80,486 would breach the setup’s support threshold.
That outcome would shift attention toward $80,126.04, rather than confirm the anticipated rebound. Bitcoin’s immediate setup centers on two tests: defending the order block and reclaiming resistance. The illustrated path remains conditional until price confirms those steps.
FAQs
The chart projects a retest after an initial rise toward $81,800; it does not confirm the move.
It would show a return inside the range, without independently establishing a bullish reversal.
It marks resistance that BTC remained below in both chart snapshots.
The immediate chart target is the previous $82,100 high.
A four-hour close below $80,486 would invalidate the immediate setup.
Related: Why Bitcoin’s $85K Level Could Be the Next Major Test
Disclaimer: The information presented in this article is for informational and educational purposes only. The article does not constitute financial advice or advice of any kind. Coin Edition is not responsible for any losses incurred as a result of the utilization of content, products, or services mentioned. Readers are advised to exercise caution before taking any action related to the company.