

- Bitcoin falls below the $84,304 equilibrium, putting the $81,178 range low in focus.
- Japan’s 10-year JGB yield rises to 3.075%, its highest level since August 1996.
- A sustained 4H or daily close below $84,304 would strengthen the bearish setup.
Bitcoin has slipped beneath the $84,304.02 daily equilibrium after rejecting a bearish fair value gap above the range midpoint. Meanwhile, Japan’s 10-year JGB yield has reached 3.075%, adding a macro headwind as global sovereign bonds face renewed selling pressure.
| Chart Price | Key Pivot | JGB Yield | Downside Reference |
| $83,892.95 | $84,304.02 | 3.075% | $81,178.01 |
Bitcoin Equilibrium Break Shifts Focus Toward $81,178
Bitcoin traded near $83,892.95 on the four-hour chart, placing the price beneath the $84,304.02 midpoint of its current daily range. That range extends from $81,178.01 to $87,395.67, with its 0.5 equilibrium separating the upper and lower halves.
BTC previously moved into the upper half and approached $87,000 before losing momentum near the bearish fair value gap. Price then rejected that imbalance and moved through $84,304.02, returning the market to the lower half of the established range.
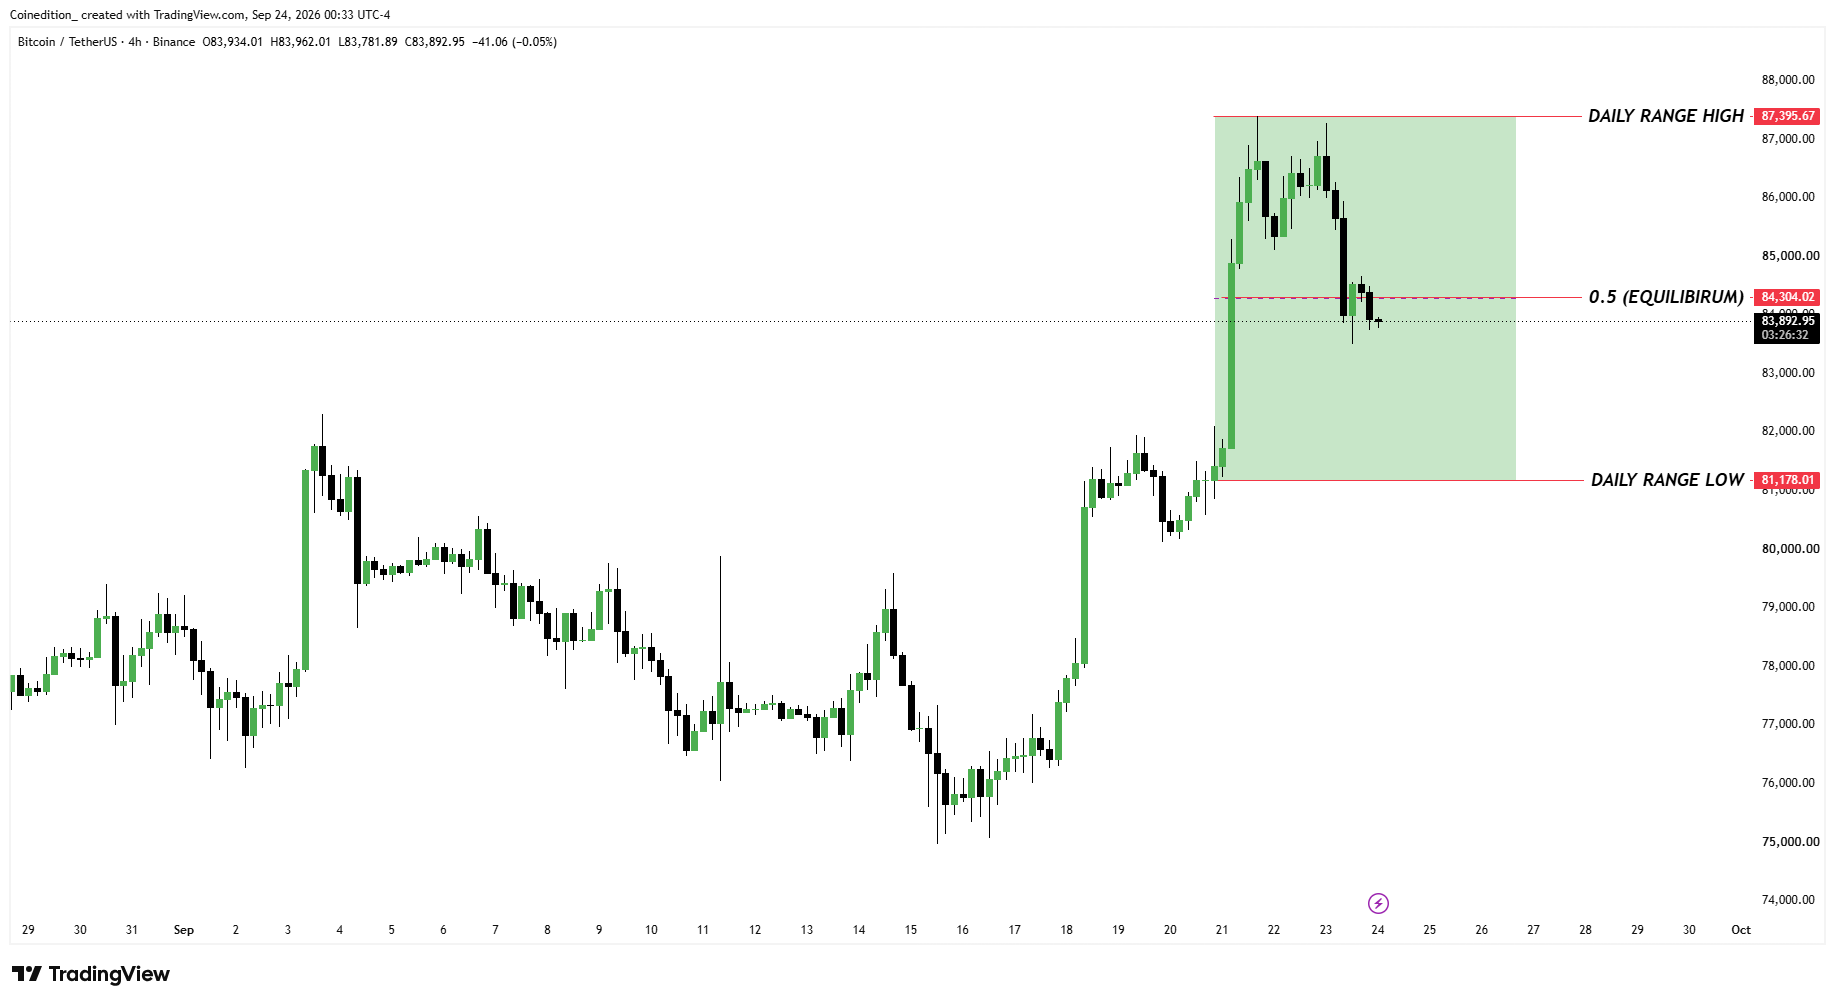
However, the move below equilibrium still requires closing confirmation. A sustained four-hour close beneath $84,304.02 would establish stronger acceptance below the midpoint rather than a temporary liquidity move.
A daily close would provide stronger confirmation, as it would preserve the breakdown across a higher timeframe. If that acceptance develops, $81,178.01 becomes the next marked liquidity reference.
The range low sits roughly 3.2% beneath the chart price, making it the clearest downside level inside the existing structure.
JGB Sell-Off Adds a Second Layer of Market Pressure
The technical break has coincided with another significant repricing across Japan’s government bond market. The 10-year JGB yield climbed 10 basis points to 3.075% on September 24, reaching its highest reading since August 1996.
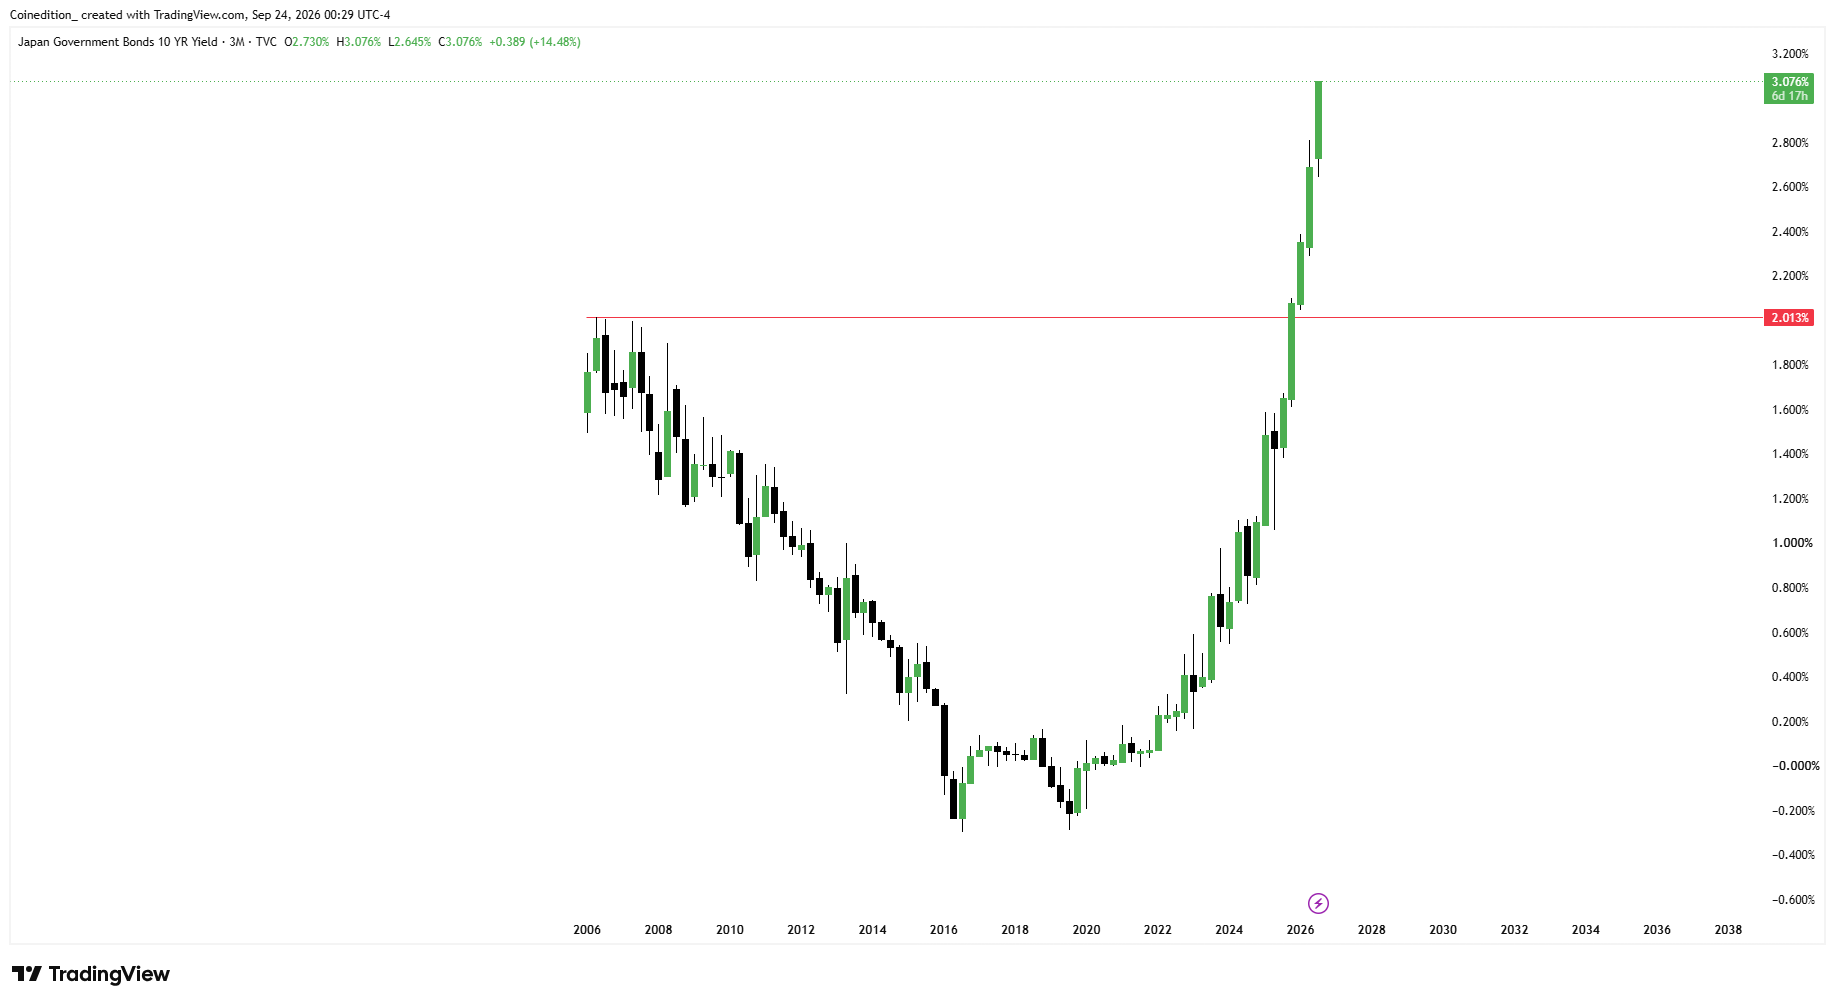
Japan’s five-year yield also increased 10 basis points, reaching a record 2.375% during the same session. Those moves followed additional weakness in U.S. Treasuries as selling pressure continued across major sovereign debt markets.
Japanese borrowing costs had already approached the 3% threshold earlier this month. The September 1 auction for 10-year government debt produced an average yield of 2.995%, leaving rates immediately below that milestone.
Therefore, the latest move represents an extension of an existing bond repricing rather than an isolated one-day adjustment. It also follows the Bank of Japan’s September 18 policy decision.
The central bank raised its policy rate by 25 basis points to 1.25%, its highest level in 31 years. That decision passed by a 7-2 vote, placing additional attention on Japanese interest rates before the latest JGB sell-off.
Rising Yields Reinforce the Existing BTC Technical Setup
The Japanese bond move does not establish Bitcoin’s direction by itself. Instead, it adds a macro layer to a chart structure already showing weakness beneath equilibrium.
Higher sovereign yields raise returns available on yield-bearing assets while reflecting tighter financial conditions across global markets. That relationship becomes more relevant when BTC is simultaneously struggling below an important technical midpoint.
Consequently, $84,304.02 remains the level connecting the technical and macro sides of the current setup. Continued acceptance beneath that price would preserve the lower-half structure while Japanese and U.S. bond markets remain under pressure.
By contrast, reclaiming the midpoint would weaken the immediate bearish reading regardless of elevated bond yields. The chart therefore keeps price confirmation, rather than the JGB move alone, at the center of the outlook.
Levels That Decide Bitcoin’s Next Range Move
| Level | Role in the Current Setup |
| $87,395.67 | Daily range high and upper liquidity |
| $84,304.02 | 0.5 equilibrium and confirmation level |
| $83,892.95 | BTC price shown on the chart |
| $81,178.01 | Daily range low and downside liquidity |
Breakdown case: Sustained four-hour or daily acceptance below $84,304.02 keeps Bitcoin inside the lower range and leaves $81,178.01 exposed.
Failure case: A reclaim and sustained hold above $84,304.02 would weaken the bearish FVG rejection and shift focus toward $87,395.67.
Bottom Line
Bitcoin’s break below equilibrium has moved the $81,178.01 daily low into focus while Japanese bond yields reach levels unseen for three decades. However, the technical setup still depends on sustained acceptance below $84,304.02. The JGB sell-off strengthens the broader risk backdrop, but the chart’s confirmation level remains the decisive measure of whether downside pressure persists.
FAQs
It marks the 0.5 equilibrium between the $81,178.01 daily low and $87,395.67 daily high.
A sustained four-hour or daily close beneath equilibrium would show stronger acceptance inside the range’s lower half.
It marks the established daily range low and the next major downside liquidity reference.
The yield surge adds a macro headwind by tightening financial conditions alongside weakness already visible on the chart.
A sustained reclaim above $84,304.02 would undermine the equilibrium breakdown and return attention toward $87,395.67.
Related: Bitcoin May Be Front-Running a Dollar Reversal as DXY Rallies
Disclaimer: The information presented in this article is for informational and educational purposes only. The article does not constitute financial advice or advice of any kind. Coin Edition is not responsible for any losses incurred as a result of the utilization of content, products, or services mentioned. Readers are advised to exercise caution before taking any action related to the company.