






- Spot Bitcoin ETFs bled $733.43M on May 27 led by BlackRock IBIT shedding $527.84M alone.
- BTC dropped below the bear market resistance band on the daily with the SAR at $78,015 holding overhead.
- Analyst Benjamin Cowen flags June as the historical weak point in midterm years with a Q4 low as the likely cycle bottom.
Bitcoin trades at $73,396 on May 28, down 1.24% after losing the bear market resistance band on the daily chart, as spot ETF outflows accelerate and the 0.5 Fibonacci level at $75,574 fails to hold as support.
BTC Daily Chart: Rejected at $75,574 and the 0.382 Fib at $71,898 Is Now Exposed
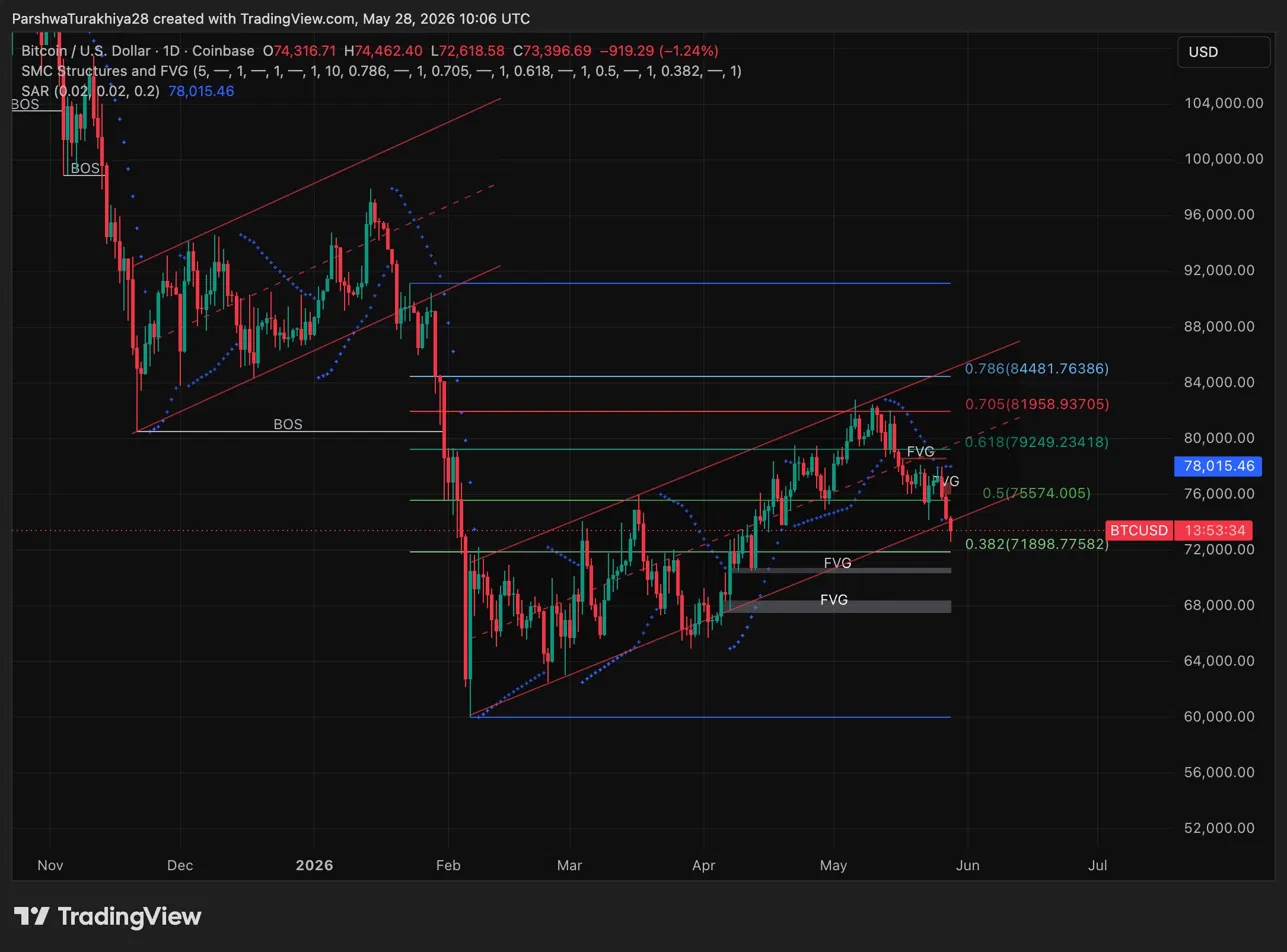
The daily chart rejected cleanly off the 0.5 Fibonacci level at $75,574 after a brief recovery attempt in May. Price is now pressing lower with the SAR at $78,015 sitting well above, keeping the daily bias firmly bearish. Two FVG zones are visible below current price between $68,000 and $72,000, acting as the next magnet if the 0.382 Fib at $71,898 gives way.
The chart structure shows a Break of Structure from the November highs that has not been recovered. Every rally since February has been sold into, with the 0.618 Fib at $79,249 and the 0.705 at $81,958 capping the May recovery attempt. For any bullish case to develop, BTC needs a daily close back above $75,574 and a flip of the SAR, neither of which is close right now.
Key levels:
- Resistance: $75,574 (0.5 Fib), $78,015 (SAR), $79,249 (0.618 Fib)
- Support: $71,898 (0.382 Fib), $68,000 (FVG zone), $63,000 (lower FVG)
ETF Outflows Are Accelerating and BlackRock Is Leading the Exit
Spot Bitcoin ETFs recorded $733.43M in net outflows on May 27, the largest single-day bleed in weeks. BlackRock’s IBIT alone pulled $527.84M, with Grayscale GBTC adding $104.76M and Fidelity FBTC contributing $60.30M. Total net assets across all products now sit at $96.45B, down from a peak above $109B in April. Outflows have printed red on nine of the last eleven trading days, pushing cumulative net inflows down to $56.02B.
When institutional products of this size see consecutive outflows led by the largest fund, it signals genuine position reduction rather than routine rebalancing. That kind of sustained selling pressure does not reverse quickly.
Why the Midterm Year Pattern Points to More Pain Before the Bottom
Analyst Benjamin Cowen flagged that Bitcoin has now fallen back below the bear market resistance band on the daily chart, with the 20-week moving average sitting near $74,000. He points to 2018 as the most relevant historical parallel, where Bitcoin faced a weak June, a summer bounce, and then a final capitulation drop in Q4 before the bear market ended.
In every midterm year, the pattern has been the same. BTC briefly clears the bear market resistance band, bulls celebrate, and then price slowly gives back the entire move. The counter-trend rallies are the dangerous part, timing them is nearly impossible and most traders get caught holding at the wrong moment. Cowen’s view is that the bottom is time-based rather than price-based, people giving up drives the end of bear markets, not a specific price target.
BTC Price Prediction for May 29
- Upside: Reclaiming $75,574 on a daily close and flipping the SAR at $78,015 opens a move back toward the 0.618 Fib at $79,249.
- Downside: Losing $71,898 exposes the FVG zone between $68,000 and $72,000, with the lower FVG near $63,000 as the next meaningful demand area below that.
Disclaimer: The information presented in this article is for informational and educational purposes only. The article does not constitute financial advice or advice of any kind. Coin Edition is not responsible for any losses incurred as a result of the utilization of content, products, or services mentioned. Readers are advised to exercise caution before taking any action related to the company.




