


- Bitcoin stays below major EMAs as key resistance levels continue limiting recovery.
- Falling open interest signals weaker leverage and cautious trader positioning.
- Exchange outflows point to steady long-term accumulation despite bearish momentum.
Bitcoin enters July with sellers still controlling the broader market, even as signs of long-term accumulation continue beneath the surface. The cryptocurrency has stabilized after a prolonged decline, yet buyers have failed to regain key technical levels that would signal a meaningful recovery.
Key Price Levels Will Shape Bitcoin’s Next Move
Bitcoin trades near $59,400 after rebounding from the $58,200 support zone. However, the broader daily structure still favors sellers. Price continues to trade below the 20, 50, 100, and 200-day exponential moving averages. This alignment confirms that the dominant trend remains bearish.
The recent recovery has also lacked convincing momentum. The BB %B reading near 0.13 indicates Bitcoin is climbing from oversold territory. Even so, the indicator has not confirmed a lasting bullish reversal.
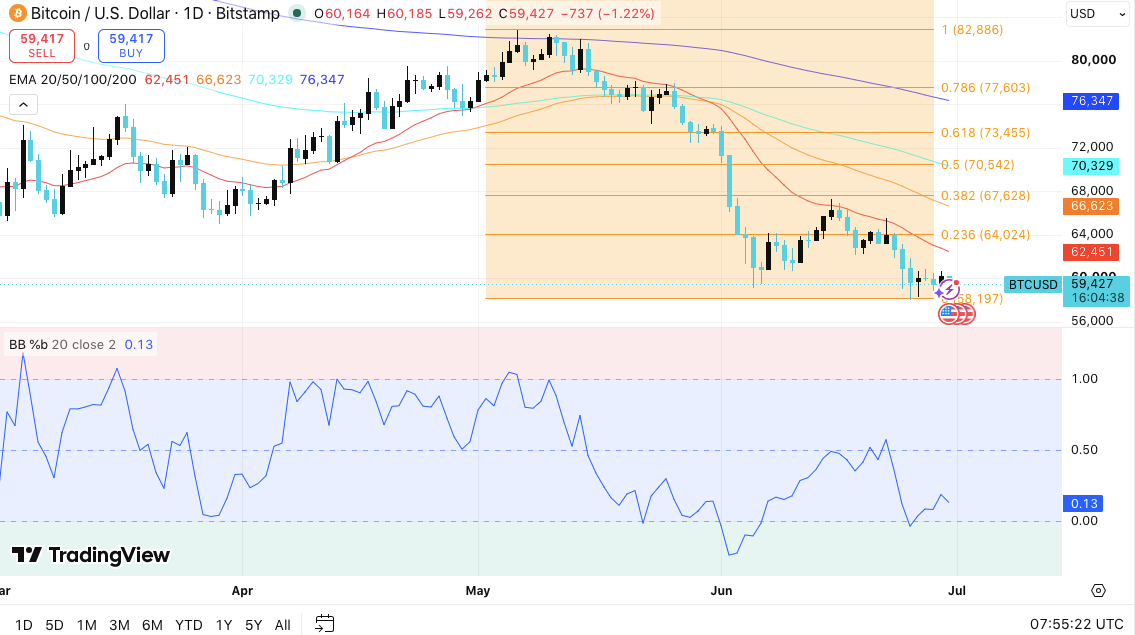
The first support remains between $58,200 and $58,500. A breakdown below this area could expose the major Fibonacci support around $56,200. Consequently, sellers could regain stronger control if that level fails.
On the upside, Bitcoin must first reclaim the 20-day EMA near $62,450. Beyond that, resistance stands between $64,000 and $64,100.
Related: XRP Price Prediction July 2026: Can Nine Weeks of ETF Inflows Save XRP at $1
A stronger recovery would then target the $66,600 to $67,600 region, where technical resistance becomes significantly heavier. Moreover, bulls would need sustained buying pressure before challenging the higher Fibonacci levels near $70,500 and $73,450.
Open Interest Declines as Traders Reduce Risk
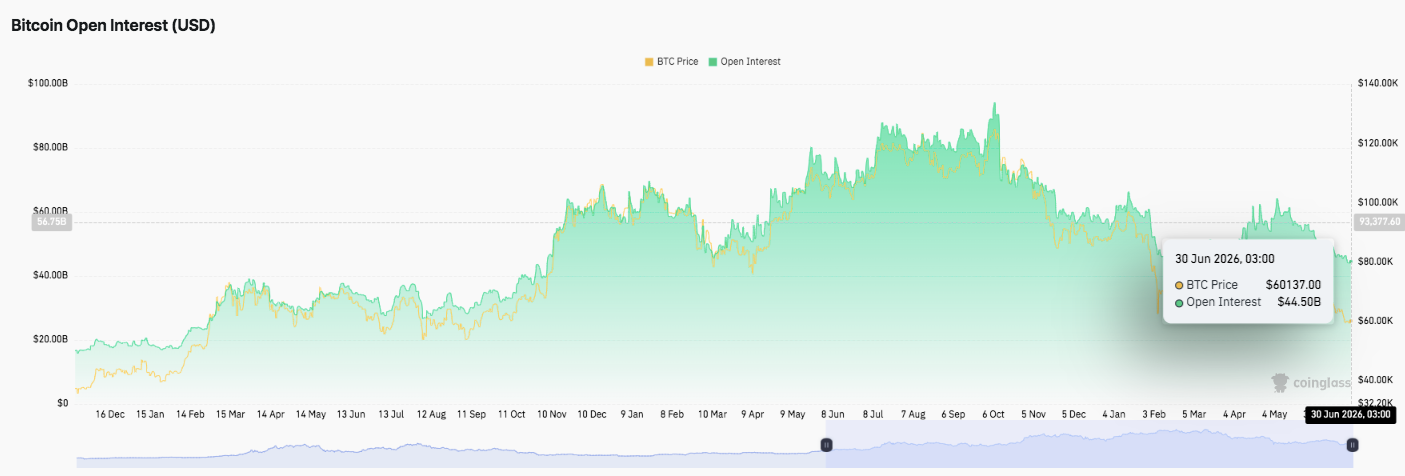
Derivatives data shows market participants continue reducing leveraged exposure. Open interest has dropped sharply from above $90 billion to roughly $44.5 billion over recent weeks. This steady decline reflects long liquidations, profit-taking, and weaker speculative demand.
Additionally, temporary increases in open interest during previous rebounds failed to establish lasting strength. Unless fresh positions enter the market alongside rising prices, Bitcoin may continue trading within a limited range.
Exchange Outflows Suggest Long-Term Confidence
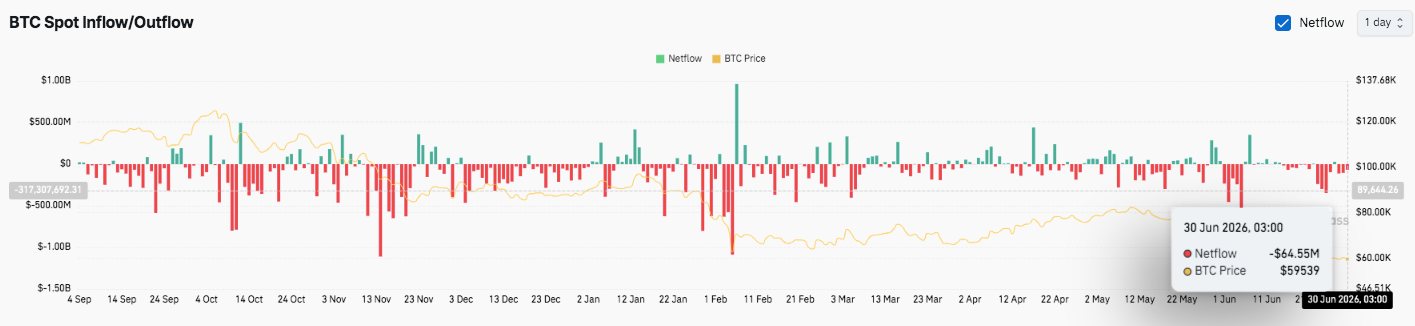
Spot flow data presents a more constructive picture despite the bearish technical outlook. Exchange outflows continue to outweigh inflows, indicating many investors prefer holding Bitcoin in self-custody instead of preparing to sell.
Recent net outflows of approximately $64.55 million reinforce that trend, even though occasional inflow spikes appeared during earlier rallies. Besides, Bitcoin has remained relatively stable despite subdued exchange activity.
Related: Dogecoin Price Prediction for July 2026: Can DOGE Defend $0.0720 as Selling Pressure Persists?
That resilience suggests long-term accumulation continues. However, buyers still need stronger momentum to reverse the prevailing downtrend and shift market sentiment in July.
Technical Outlook for Bitcoin Price
Key technical levels remain firmly in focus as Bitcoin heads into July, with price attempting to stabilize after an extended corrective phase.
Upside levels: $62,450 (20-day EMA) remains the first resistance. A sustained breakout could target $64,000-$64,100, followed by the major supply zone between $66,600 and $67,600. If bullish momentum strengthens further, Bitcoin could extend gains toward $70,500 and $73,450.
Downside levels: Immediate support lies at $58,200-$58,500, where buyers recently stepped in. A decisive break below this area would expose the major Fibonacci support at $56,200 and increase the risk of a deeper correction.
Resistance ceiling: The $66,600-$67,600 zone, where the 50-day EMA aligns with the 38.2% Fibonacci retracement, remains the key barrier bulls must overcome to shift the medium-term trend in their favor.
The broader technical picture still favors bears, as Bitcoin continues to trade below all major exponential moving averages. However, oversold momentum indicators and persistent exchange outflows suggest long-term accumulation may be quietly building beneath the surface.
Will Bitcoin Go Up in July?
Bitcoin’s July outlook depends on whether buyers can reclaim the 20-day EMA near $62,450 and sustain momentum above the $64,000 resistance area. A successful breakout could encourage renewed buying interest and pave the way for a rally toward $66,600-$67,600, with higher Fibonacci targets at $70,500 and $73,450 coming into view.
Related: Ethereum Price Prediction July 2026: Robert Kiyosaki Says ETH Hits $95,000 After the Next Crash
However, failure to defend the $58,200 support zone would reinforce the prevailing downtrend and expose Bitcoin to $56,200. While continued exchange outflows point to ongoing accumulation, declining open interest highlights cautious market participation. Until price and derivatives activity strengthen together, Bitcoin is likely to remain range-bound with a bearish bias.
Disclaimer: The information presented in this article is for informational and educational purposes only. The article does not constitute financial advice or advice of any kind. Coin Edition is not responsible for any losses incurred as a result of the utilization of content, products, or services mentioned. Readers are advised to exercise caution before taking any action related to the company.


 Price Prediction 2026, 2027, 2028, 2029, 2030-2050")

