

- BTC price prediction stays bullish above $77,992, needs $81,233 cleared to extend the rising channel
- This week’s ETF inflows already hit $651.93M in two days, on pace to challenge last week’s $1.92B record
- Ben Cowen says a further drop before year-end is still possible, despite buying BTC himself since July
Two days into this week, Bitcoin ETFs have already pulled in $651.93M, more than a third of last week’s $1.92B total. That pace matters more than today’s 0.09% dip. BTC is still consolidating inside the rising channel that’s held since August 20, and whether ETF demand keeps up this pace through Friday says more about the setup than the daily candle does.
Bitcoin Price Analysis: Will Bitcoin Price Go Up Inside Its Rising Channel?
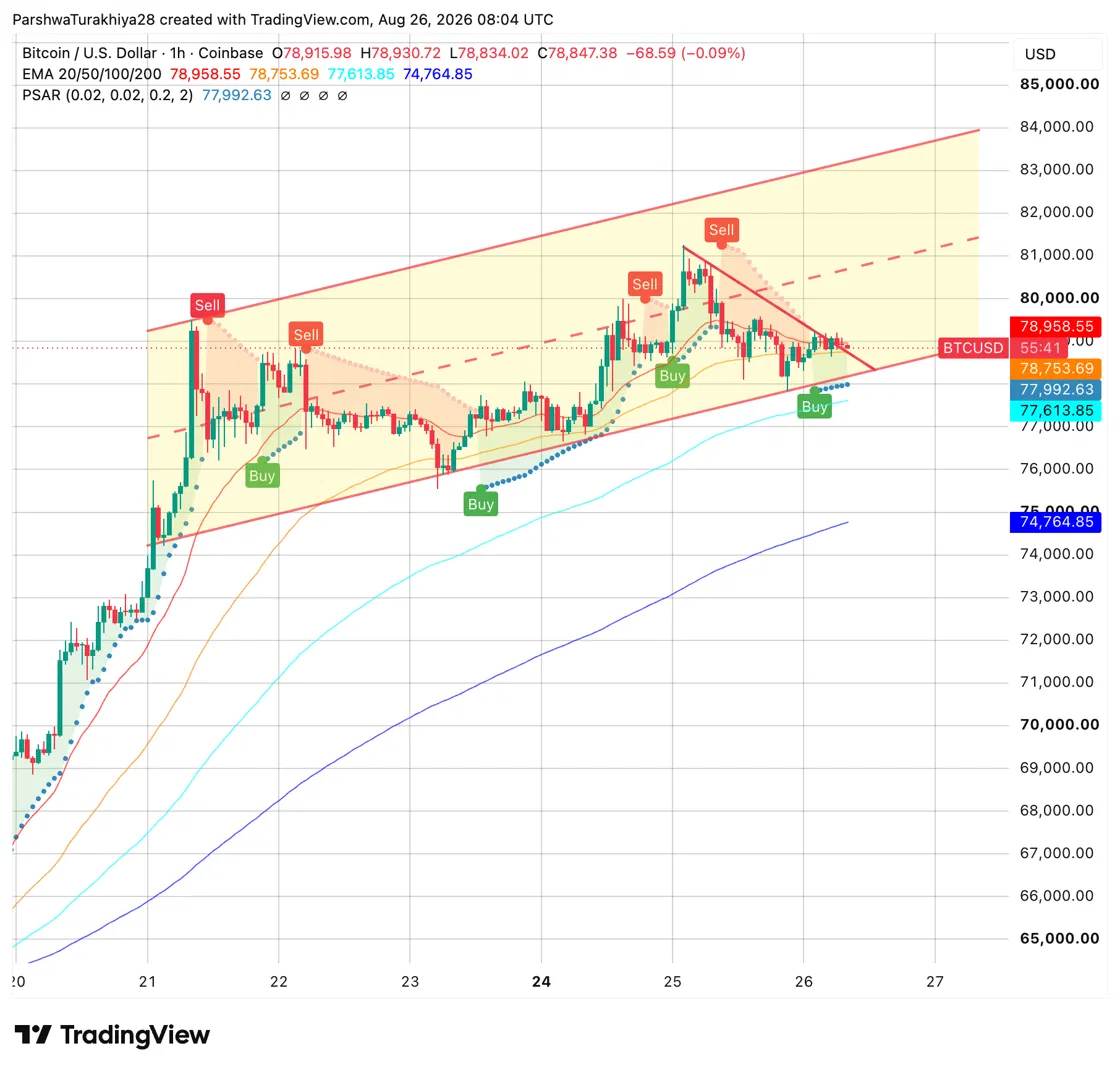
BTC has climbed inside a rising channel since August 20, with higher lows and higher highs both intact. Price touched $81,233 on August 25 before pulling back through a small descending pattern, and is now consolidating just under the 20-day EMA at $78,958.55.
The Parabolic SAR sits at $77,992.63, still below price, keeping the short-term trend bullish. The 50-day EMA at $78,753.69 is almost exactly where price is sitting right now, so BTC is actively testing this level rather than sitting clearly above or below it.
Related: Stacks Price Prediction: Can STX Break $0.30 After 132% Weekly Surge?
The 100-day EMA at $77,613.85 and 200-day at $74,764.85 sit well below, giving the setup room to breathe if the pullback deepens without threatening the broader trend. The channel’s lower boundary tracks near $75,000; the upper boundary extends toward $84,000.
BTC Support and Resistance Levels, August 26, 2026
| Type | Price | Level |
| Resistance | $81,233 | Weekly high |
| Resistance | $82,000 | Prior May resistance, flagged by LuckSide Crypto |
| Support | $78,958.55 | 20-day EMA |
| Support | $78,753.69 | 50-day EMA |
| Support | $77,992.63 | Parabolic SAR |
| Support | $77,613.85 | 100-day EMA |
Bitcoin News: This Week’s ETF Inflows Already at $651.93M, Chasing Last Week’s Record
Bitcoin ETFs pulled in $651.93M across the first two trading days of this week, according to SoSoValue, with $337.56M on August 24 followed by $314.37M on August 25, led again by BlackRock’s IBIT at $284.42M. Three trading days remain, and matching last week’s pace would put the full week north of $1.6B.
Last week itself set the bar: Bitcoin ETFs took in $1.92B for the week ending August 21, the strongest week since October 2025, when Bitcoin was setting its all-time high above $126,000. Cumulative net inflow across all Bitcoin ETFs now stands at $54.36B, with total net assets at $99.05B, within reach of $100B for the first time.
| Week Ending | BTC ETF Weekly Net Inflow |
| Aug 25, 2026 (2 days in) | $651.93M so far |
| Aug 21, 2026 | $1.92B (best since Oct 2025) |
| Aug 14, 2026 | -$389.71M |
| Aug 7, 2026 | $853.54M |
Bitcoin News: Ben Cowen Says a Late-Year Drop Is Still Possible Despite Buying Since July
Analyst Ben Cowen told Cointelegraph he began buying Bitcoin in July when it briefly dipped below $60,000, calling it his standard approach for the second half of a “midterm year,” the year before a U.S. presidential election, based on the same pattern he followed in 2018 and 2022. Cowen was clear that buying doesn’t mean he’s certain the bottom is in. He said whether this year’s low has already happened won’t matter much a year from now regardless of exact entry price, but the next few months are harder to call.
Cowen said there’s still a “good chance” of one more sell-off before year-end, though he no longer anchors that specifically to October, the month he originally flagged based on prior bear markets lasting roughly a year from their tops. He compared this year’s rallies to 2018, when Bitcoin rallied to around $9,800 in May, then $8,200 in July, then $7,300 in August, a shape similar to this year’s moves to $98,000, then $82,000, and now into the high $70,000s, without that pattern ultimately marking the bear market’s end.
What Would Change Cowen’s Mind
If Bitcoin holds above $60,000 through the rest of 2026 without a further drop, Cowen said he’d stop being bearish heading into 2027. He tied his outlook to the S&P 500, noting that in 2014, 2018, and 2022, a second stock market correction later in the year tended to coincide with Bitcoin’s actual cycle low, and said he’s watching for a 10-20% S&P pullback before year-end as the more likely trigger, not a larger crash.
Bitcoin News: Market Sentiment Sits at 65, Greed Territory
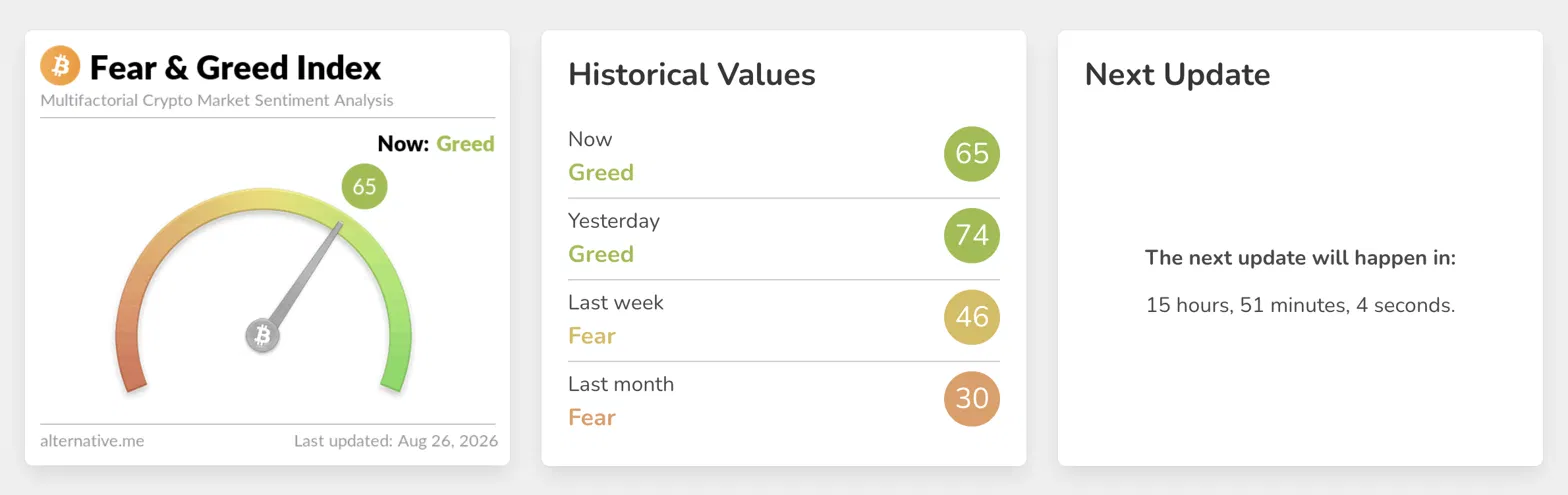
The Crypto Fear and Greed Index reads 65 as of August 26, in Greed territory, down from 74 the day before.
Related: Cardano Price Prediction: Is ADA’s Pullback From $0.26 a Reset or a Warning Sign?
A week ago it read 46, in Fear; a month ago it sat at 30, also Fear. The swing from fear to greed over the past month tracks Bitcoin’s move from the low $60,000s in early August to briefly above $81,000.
Our Take: The Real Number to Watch Isn’t the Total, It’s IBIT’s Share of It
On August 25, IBIT alone accounted for $284.42M of the day’s $314.37M total inflow, over 90%. That concentration is easy to miss when headlines just report the aggregate. A “record week” built almost entirely on one fund isn’t the same signal as broad-based demand across Fidelity, Bitwise, and the rest of the field, and it’s more fragile.
If IBIT’s pace slows even slightly, the weekly total drops fast regardless of what BTC does. Worth checking Wednesday’s breakdown by ticker, not just the daily total, before reading this week as confirmation of anything.
FAQ: Bitcoin Price Prediction
BTC price is consolidating inside a rising channel that’s held since August 20. The setup stays bullish above $77,992 at the Parabolic SAR, and clearing $81,233 would extend the channel toward its upper boundary near $84,000.
Yes, at the current pace. Bitcoin ETFs have pulled in roughly $3 billion so far this August, sitting about $390 million short of October 2025’s total with four trading sessions still remaining, putting the month on track to be the strongest since then.
Price ran into a resistance zone near $81,233 to $82,000 that combines the top of the current rising channel with the same level that capped Bitcoin’s rally back in May, and pulled back through a small descending pattern rather than clearing it outright.
Bitcoin is showing real strength in both price structure and ETF demand right now, but analysts, who has been buying since July, still see a real chance of one more drop before year-end. This is not financial advice, so weigh the bullish setup against that caution and your own research.
Two forces are doing most of the work: a rising technical channel that’s held since August 20, and $651.93 million in ETF inflows across just the first two trading days, more than a third of last week’s record total.
Analyst Ben Cowen says he’d stop being bearish heading into 2027 if Bitcoin holds above $60,000 through the rest of 2026 without a further drop. He’s watching for a 10 to 20% S&P 500 pullback as the more likely trigger for Bitcoin’s actual cycle low, rather than a larger crash, based on the pattern he tracked in 2014, 2018, and 2022.
Bitcoin’s all-time high sits above $126,000, set in October 2025, meaning BTC would need to climb roughly 60% from current levels near $78,847 to get back there. Nothing in the current technical setup points to a specific timeline for that move, and analyst’s outlook suggests the next few months still carry real uncertainty in either direction.
Disclaimer: The information presented in this article is for informational and educational purposes only. The article does not constitute financial advice or advice of any kind. Coin Edition is not responsible for any losses incurred as a result of the utilization of content, products, or services mentioned. Readers are advised to exercise caution before taking any action related to the company.