

- Ethereum price prediction stays bullish above $2,650, targeting $2,800 first and $3,000 next
- Short sellers lost $24.72 million of ETH’s $31.70 million in 24-hour liquidations
- US spot ETH ETFs recorded $138.02 million in outflows last week after a $689.88 million inflow the week before
Ethereum price prediction for October stays bullish above $2,650, the support ETH needs to hold as it presses against a rising trendline near $2,700.
Ethereum Price Analysis: Can ETH Break Through the $2,700 Trendline in October?
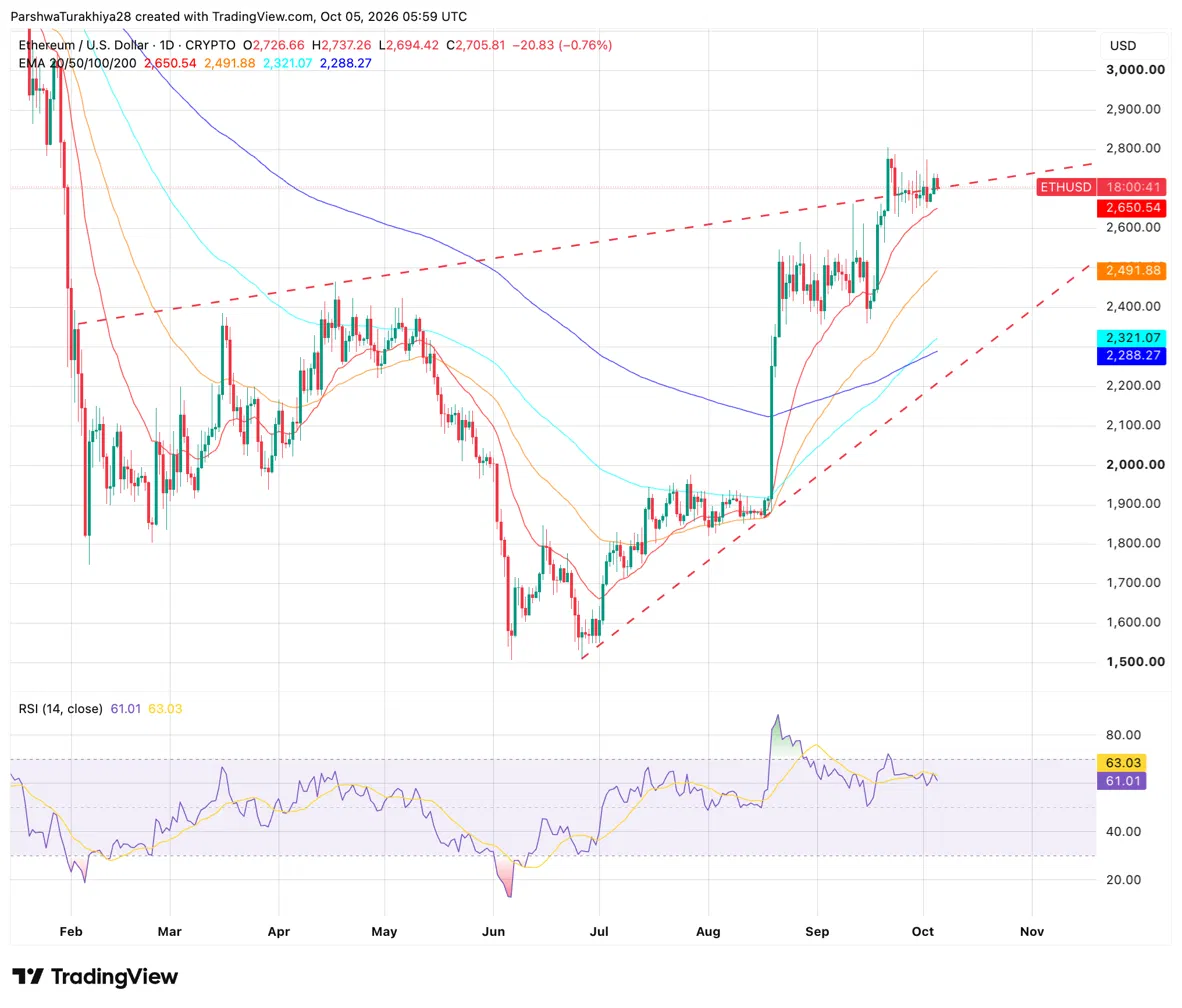
ETH trades near $2,706, down 0.76% today, and is pressing against a rising trendline near $2,700 that it has tested repeatedly since peaking near $2,800 around September 22. A daily close above that line, followed by a move through the $2,800 peak, would put $3,000 in view.
The 20-day EMA at $2,650.54 is the first support, followed by the 50-day at $2,491.88, while the 100-day at $2,321.07 now sits above the 200-day at $2,288.27. A second rising line from the late-June low, near $2,200 today, runs beneath price, and RSI at 61.01 remains below the 70 mark, which leaves room for another push before momentum looks stretched.
Related: Cardano Price Prediction: Will ADA’s Bull Pennant Breakout Push It Toward $0.30?
ETH Support and Resistance Levels for October 2026
| Type | Price |
| Resistance | $2,750 |
| Resistance | $2,800 |
| Resistance | $3,000 |
| Support | $2,650 |
| Support | $2,492 |
| Support | $2,321 |
ETH News: Altcoin Daily Maps Five-Year ETH Targets From $16,000 to $50,000
Altcoin Daily’s latest video builds five-year ETH scenarios from three analysts, and the dollar figures are the host’s own conversions rather than targets the analysts published:
- Jordi Visser expects the total crypto market to approach $50 trillion to $100 trillion within five years, against about $2.9 trillion now, which the host converts into roughly $43,000 per ETH if it keeps pace.
- Tom Lee says ETH has consolidated for five years and could gain tenfold if it breaks $5,000, which the host puts near $50,000.
- Raoul Pal estimates $1 trillion to $2 trillion of economic activity depends on Ethereum, which against an ETH market cap near $331 billion works out to about 6x, or roughly $16,000 per coin.
Visser also said “I believe Ethereum will outperform Bitcoin this year,” and the host opens with the claim that ETH ETFs have drawn more 2026 inflows than Bitcoin ETFs, which the video does not source. The video promotes a trading app with a referral code and frames ETH as a long-term hold, so the targets read as bullish scenarios rather than forecasts, and none of them speaks to October.
Ethereum Derivatives: Short Sellers Lose $24.72 Million in 24 Hours

Traders betting on a falling ETH price, known as short sellers, lost $24.72 million of the $31.70 million in forced closures over the past day as price pushed against its trendline. Open interest, the total value of bets still open, barely moved at $34.10 billion, so the squeeze happened without a wave of new money. Most traders still lean bullish, with Binance showing 2.51 long accounts for every short.
| Metric | Value | What it means |
| Futures volume (24h) | $25.68B, up 9.11% | Trading is picking up |
| Open interest | $34.10B, up 1.08% | Open bets barely changed |
| Options volume (24h) | $1.51B, up 74.78% | Far more activity in options bets |
| Short liquidations (24h) | $24.72M of $31.70M | Bets against ETH took most of the losses |
| Binance long/short ratio | 2.51 | About 2.5 long accounts for every short |
ETH ETF Flows: US Spot Funds Lose $138.02 Million Last Week
US spot Ether ETFs recorded net outflows of $138.02 million in the week ending October 2, after taking in $689.88 million the week before according to SoSoValue. Friday alone brought a $37.36 million outflow, led by BlackRock’s ETHA at $20.10 million and Fidelity’s FETH at $17.25 million.
The funds have still added about $2.72 billion since the week ending July 17, with outflows in only three of the last 11 weeks, and cumulative net inflows now stand at $13.80 billion with total net assets at $17.46 billion.
| ETF Metric | Value |
| Weekly net flow, week ending Oct 2 | -$138.02M |
| Weekly net flow, week ending Sep 25 | +$689.88M |
| Cumulative net inflow | $13.80B |
| Total net assets | $17.46B |
Ethereum Price Prediction for October 2026: Where Could ETH Trade Each Week?
| Period | Expected Range | Key Levels |
| Oct 1 to 7 | $2,600 to $2,800 | The 20-day EMA at $2,650 needs to hold, and a daily close above the $2,700 trendline would clear the first hurdle. |
| Oct 8 to 14 | $2,650 to $2,800 | Holding the trendline puts the $2,800 September high in range, while losing $2,650 brings in $2,492. |
| Oct 15 to 21 | $2,492 to $3,000 | A close above $2,800 opens $3,000, while a failure sends price toward the 50-day EMA at $2,492. |
| Oct 22 to 31 | $2,321 to $3,000 | The October 28 Fed decision sets the tone, with $3,000 as resistance and the 100-day EMA at $2,321 as the floor if $2,492 gives way. |
Ethereum Price Prediction: Can ETH Reach $3,000 or Fall to $2,492 in October?
Bullish Case, Target: $3,000
ETH holds the 20-day EMA at $2,650, closes a day above the $2,700 trendline and clears the $2,800 September high, which opens $3,000. More short liquidations and a return of ETF inflows after last week’s outflow would support the move.
Bearish Case, Risk Level: $2,492 (50-Day EMA)
ETH loses $2,650 and the trendline turns back into resistance, sending price toward the 50-day EMA at $2,492. A daily close below it would expose the 100-day EMA at $2,321 and the 200-day at $2,288.
FAQs: ETH Outlook for October 2026
ETH could extend toward $2,800 and then $3,000 if it holds above $2,650 and clears the trendline near $2,700. A daily close below the 50-day EMA at $2,492 would put the 100-day EMA at $2,321 in play.
$3,000 would need a gain of about 10.9% from $2,705.81 and a clean break of the $2,800 September high. $5,000 would need about 85%, and Tom Lee’s framework treats that level as a breakout point over several years rather than one month.
Yes, if it loses $2,650 and the trendline keeps rejecting price. $2,500 is a drop of about 7.6%, and the 50-day EMA at $2,492 sits just below it.
Last week they were. US spot ETH ETFs recorded $138.02 million in net outflows in the week ending October 2, according to SoSoValue, after $689.88 million of inflows the week before, and they have still added about $2.72 billion since mid-July.
Altcoin Daily’s host uses the 4% rule, under which $200,000 a year of income needs about $5 million. At $10,000 per ETH that is 500 ETH, and at $50,000 it is 100 ETH. This is one video’s illustration rather than advice, and it assumes those prices arrive.
Disclaimer: The information presented in this article is for informational and educational purposes only. The article does not constitute financial advice or advice of any kind. Coin Edition is not responsible for any losses incurred as a result of the utilization of content, products, or services mentioned. Readers are advised to exercise caution before taking any action related to the company.