

- BMT’s breakout remains strong, but extreme momentum raises profit-taking risks.
- Rising open interest signals growing speculation and could amplify price volatility.
- Mixed exchange flows offer no clear distribution signal despite BMT’s sharp rally.
Bubblemaps (BMT) has delivered a powerful rally, with its price jumping more than 116% over 24 hours. The token now trades near $0.03834 after gaining more than 228% during the past week.
Trading activity has also expanded sharply, with 24-hour volume reaching about $361.86 million. Consequently, BMT has attracted considerable attention as traders assess whether the rally can extend further. However, the rapid advance has also pushed momentum into potentially overheated territory.
BMT Breakout Gains Momentum
BMT recently climbed from the $0.02 region and reached approximately $0.0391 on the four-hour chart. The move pushed price above the $0.03664 Fibonacci retracement level. That level now represents an important area for buyers defending the breakout.
Additionally, BMT trades comfortably above its 20, 50, 100, and 200-period exponential moving averages. This alignment reinforces the strength of the current bullish structure. Moreover, the Bollinger Band %B indicator stands at 1.03, showing that price remains above the upper band.
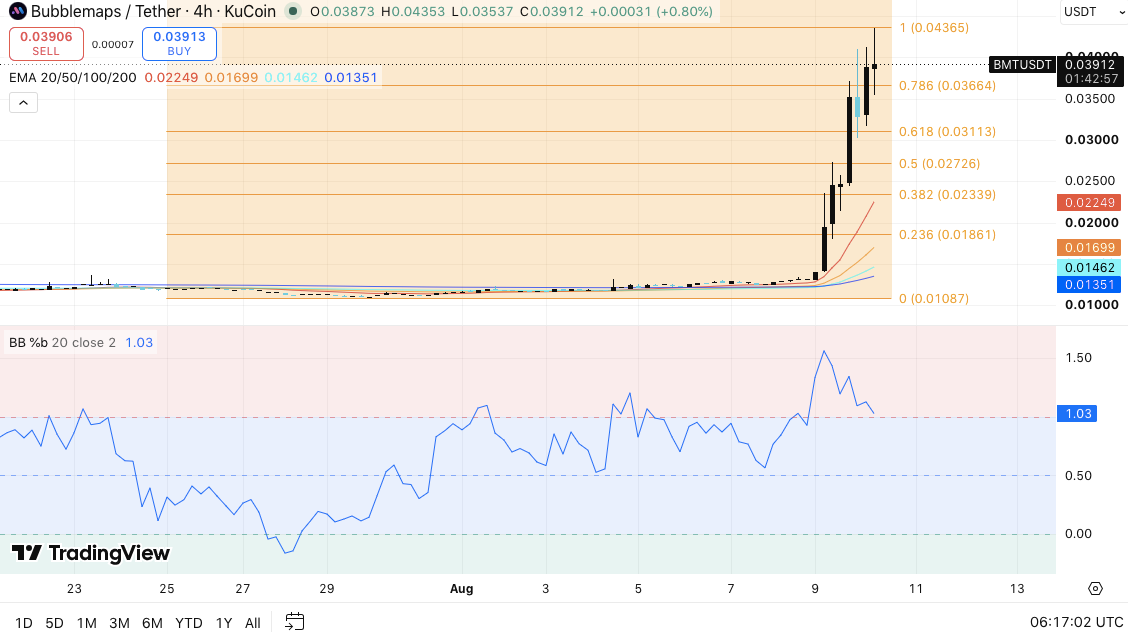
Significantly, such momentum can support further gains when buyers maintain strong demand. However, extended moves often increase the likelihood of short-term profit-taking. Hence, traders may watch $0.03664 closely during any retracement.
Related: Pump.fun Price Prediction: Can PUMP Hold Its Breakout After Selling $807M in SOL?
BMT faces immediate resistance around $0.0400 to $0.0405. A decisive move beyond that zone could bring $0.04365 into focus. Consequently, a sustained four-hour close above $0.04365 could strengthen the broader continuation setup.
Open Interest Signals Rising Speculation
The derivatives market has recently introduced another important factor into BMT’s outlook. Open interest remained subdued for months, generally fluctuating between $1.5 million and $2.5 million.
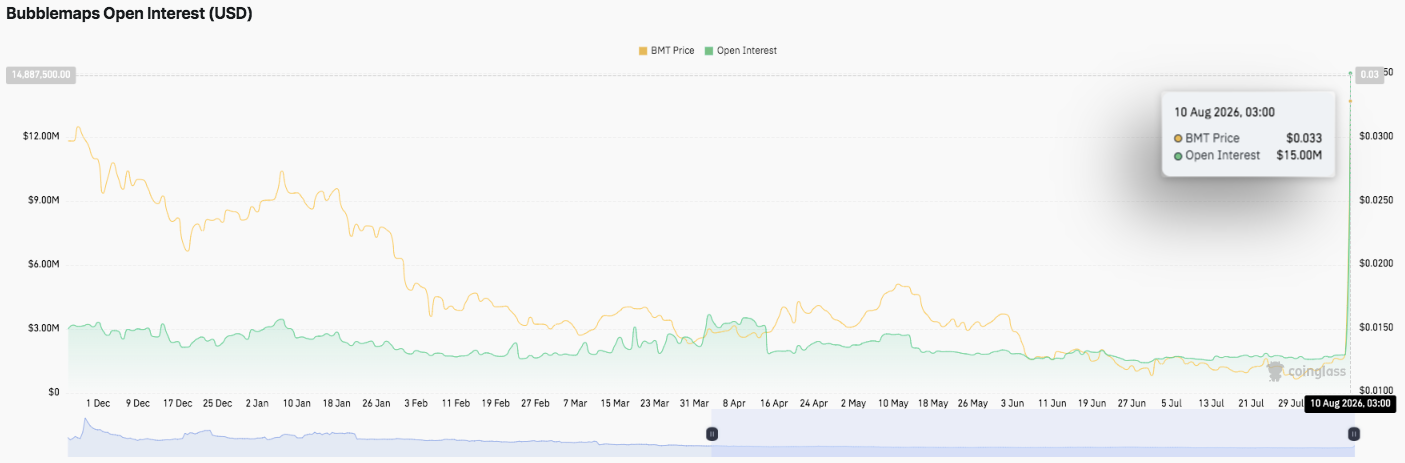
Brief increases emerged during March and April, but traders failed to maintain those higher positioning levels. However, open interest has now surged to approximately $15 million on August 10.
That increase represents a substantial expansion in leveraged positioning around the token. Consequently, BMT could experience larger price swings if traders aggressively increase or unwind positions.
Moreover, rising open interest alongside a sharp price rally can intensify both bullish momentum and downside volatility.
Flows Present a Mixed Signal
Spot exchange flows provide a less decisive picture. BMT has repeatedly shifted between inflows and outflows, showing inconsistent exchange activity.
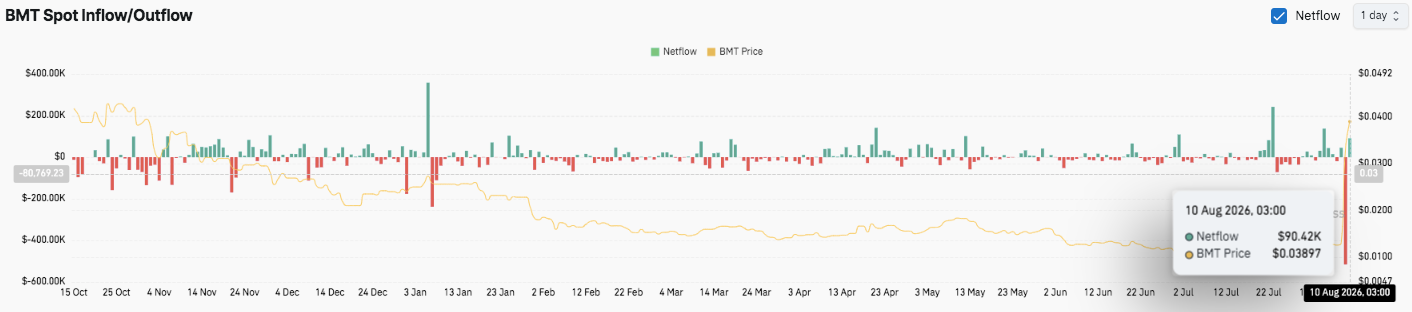
Recently, the token recorded approximately $90,420 in net inflows. That movement suggests some holders may have transferred tokens toward exchanges amid the rally.
However, previous outflows indicate periods of potential accumulation. Therefore, current flows do not yet establish a clear distribution trend.
Technical Outlook for Bubblemaps Price
Key levels remain closely watched after BMT’s explosive rally:
Upside levels: $0.0400–$0.0405 represents the immediate resistance zone, followed by $0.04365, a major Fibonacci hurdle. A decisive break above $0.04365 could signal further price discovery.
Downside levels: $0.03664 is the first major support, followed by $0.03113, $0.02726, and $0.02339. The $0.02249 20 EMA provides an additional dynamic support level. The technical picture remains strongly bullish, although BMT’s position above the upper Bollinger Band indicates short-term overextension.
Will Bubblemaps Go Up?
Bubblemaps’ near-term direction depends heavily on whether buyers can defend $0.03664 after the recent surge. Rising open interest toward $15 million suggests significantly stronger speculative participation, which could amplify the next major move.
If BMT clears $0.0405 and sustains momentum above $0.04365, the token could enter a fresh price-discovery phase. However, failure to hold $0.03664 could trigger profit-taking toward $0.03113 and $0.02726. For now, BMT remains in a pivotal breakout zone, with momentum, derivatives positioning, and exchange flows likely to determine its next direction.
Disclaimer: The information presented in this article is for informational and educational purposes only. The article does not constitute financial advice or advice of any kind. Coin Edition is not responsible for any losses incurred as a result of the utilization of content, products, or services mentioned. Readers are advised to exercise caution before taking any action related to the company.