


- BTC trades at $81,411, down 0.21%, inside a rising channel on the 4-hour chart with OBV making new highs confirming the move.
- Strategy’s Michael Saylor said the firm may sell bitcoin for the first time to fund $1.5B in annual dividend obligations, sending MSTR down 4% after hours.
- Bitcoin spot ETFs pulled $467.35M on May 5, the fourth consecutive day of inflows, pushing total net assets to $108.98B.
Bitcoin trades at $81,411 on May 6, clearing $81,000 for the first time since January as Iran tensions ease and global equities print records, before Michael Saylor’s comment about potentially selling bitcoin for the first time in Strategy’s history briefly pulled it back below that level.
BTC 4-Hour Chart: Rising Channel Intact With OBV Confirming The Move
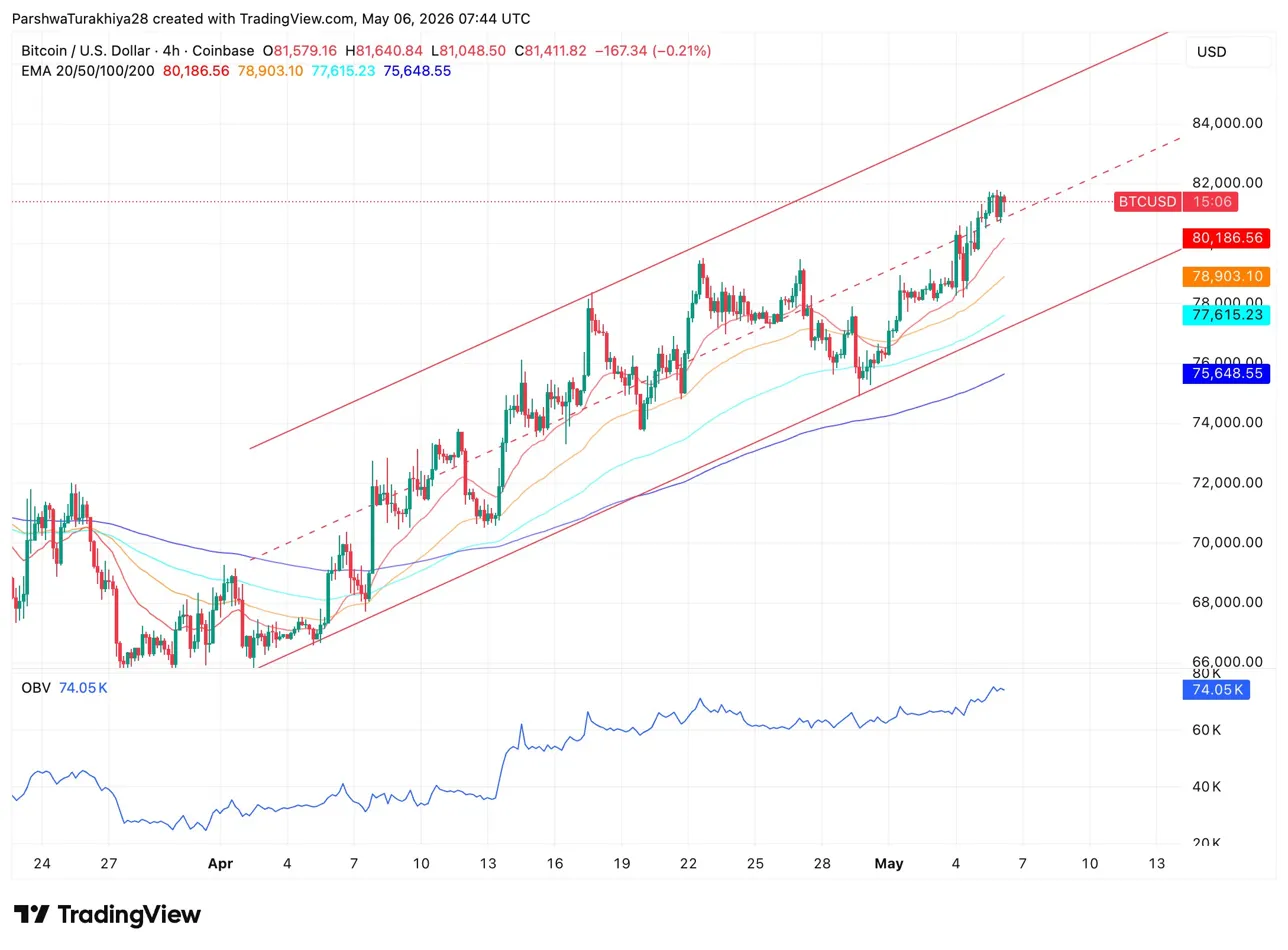
The 4-hour chart shows BTC inside a clean rising channel that has been intact since the April 7 low near $67,000. The lower boundary has held through every pullback over the past four weeks, and price is currently pressing the upper boundary near $81,500 to $82,000. The channel has produced a series of higher lows and higher highs, each supported by the rising EMA stack below.
The OBV indicator below the chart is making new highs alongside price, confirming that volume is behind the move rather than declining as price rises. That divergence matters because the primary concern around Bitcoin’s April rally was that it was futures-driven rather than spot-backed. A rising OBV is the spot demand confirmation the chart needed.
Related: Zcash Price Prediction: ZEC Surges 30% as Bulls Eye $600 Target
The 20-day EMA at $80,186 is the immediate support on any pullback, with the 50-day at $78,903 below that. Both are rising and stacked bullishly. A close above the channel upper boundary at $82,000 opens the next resistance zone at $86,000 to $88,000.
BTC Key levels for May 7:
- 50-day EMA: $78,903
- 20-day EMA: $80,186
- Current price: $81,411
- Channel upper boundary: $82,000
- Next resistance zone: $86,000 to $88,000
Four Days Of ETF Inflows Signal Spot Demand Is Back
Bitcoin spot ETFs recorded $467.35M in net inflows on May 5, the fourth consecutive positive day. BlackRock’s IBIT led at $251.43M, Fidelity’s FBTC added $133.20M, and Ark and 21Shares’ ARKB contributed $92.28M.
The reversal in flow direction alongside OBV making new highs is the clearest signal yet that spot demand has returned to support the futures-driven April rally that CryptoQuant had flagged as structurally weak.
Strategy May Sell Bitcoin For The First Time
Michael Saylor told Strategy’s Q1 2026 earnings call that the firm may sell a portion of its 818,334 BTC stack to fund dividend payments for the first time in the company’s history. His exact words: “We will probably sell some bitcoin to pay a dividend just to inoculate the market and send the message that we did it.”
Strategy carries roughly $1.5B in annual dividend obligations across preferred stock and outstanding debt, with about 18 months of USD reserves at current run-rates. The firm posted a $12.54B Q1 net loss as bitcoin’s slide from October’s $126,000 peak weighed on mark-to-market accounting. Every prior quarter, Strategy issued more debt or equity to fund obligations rather than touch the BTC position. Selling even a small amount would be a first.
MSTR dropped over 4% in after-hours trading and BTC briefly dipped below $81,000 before recovering. Saylor framed the potential sale as consistent with the broader model, buy bitcoin with credit, let it appreciate, sell some to pay the dividend, but the market read it as a break from the unconditional accumulation playbook that has defined Strategy since 2020.
BTC Derivatives: Shorts Taking More Pain Despite Price Dipping
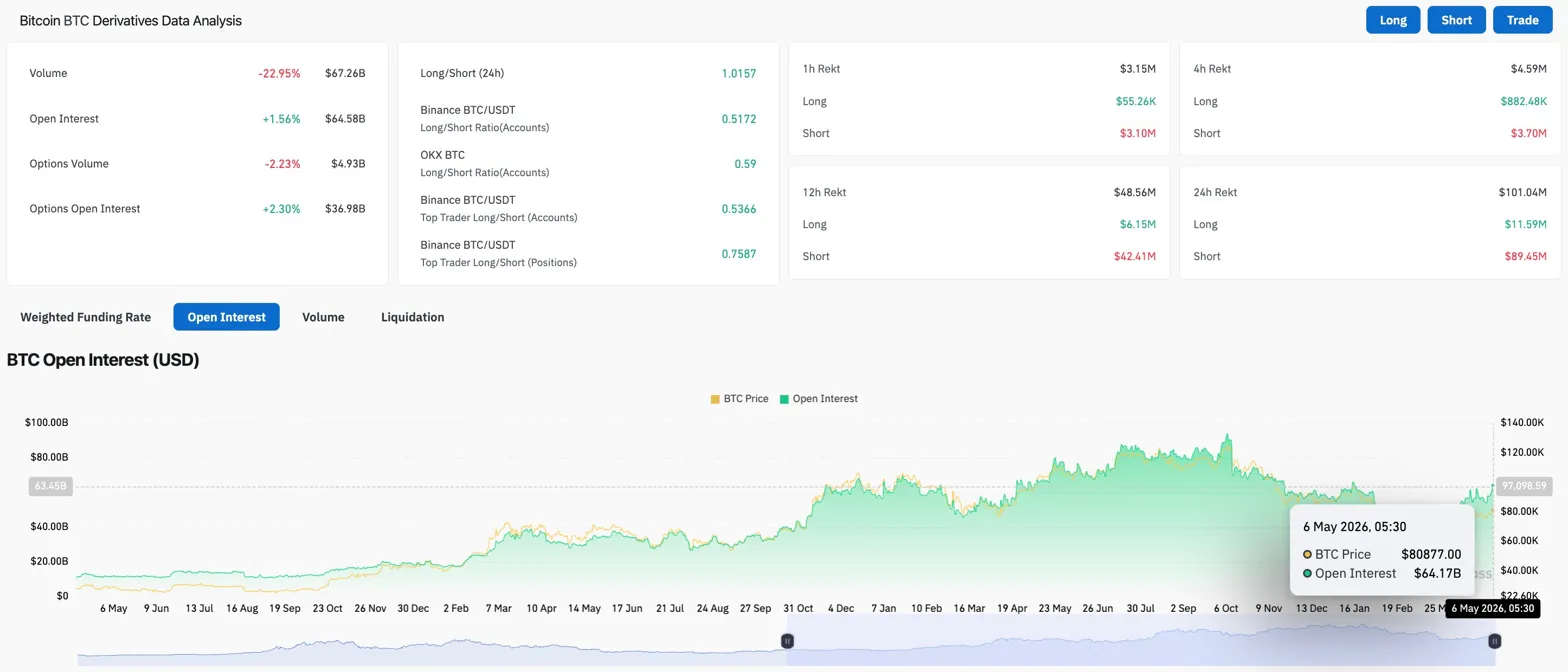
Futures volume dropped 22.95% to $67.26B while OI rose 1.56% to $64.58B, volume falling while OI builds points to positions being held quietly rather than aggressive new entries. Options volume fell 2.23% to $4.93B while options OI climbed 2.30% to $36.98B, existing directional hedges staying open as new activity dried up.
The long/short ratio sits at 1.0157, barely long. Binance top traders lean short at 0.5366 on accounts and 0.7587 on positions, while OKX accounts sit at 0.59. Over 24 hours, shorts absorbed $89.45M in liquidations against $11.59M for longs. Sellers are taking more than seven times the pain despite price being flat on the day, consistent with shorts getting squeezed on every push above $81,000. OI at $64.17B sits below the late 2025 peak near $90B.
BTC Price Prediction: May 7 Outlook
- Upside: BTC closes above the channel boundary at $82,000, opening the $86,000 to $88,000 resistance zone. Four straight ETF inflow days and OBV at new highs give this rally the spot demand backing April lacked.
- Downside: Strategy confirming a specific BTC sale amount is the headline risk that pushes price back toward the channel lower boundary at $78,000 to $79,000. Shorts absorbing seven times more liquidation pain limits how far any drop extends unless the Saylor news escalates further.
Related: Solana Price Prediction: Alpenglow Upgrade Due Next Quarter As EMA Ribbon Turns Bullish
Disclaimer: The information presented in this article is for informational and educational purposes only. The article does not constitute financial advice or advice of any kind. Coin Edition is not responsible for any losses incurred as a result of the utilization of content, products, or services mentioned. Readers are advised to exercise caution before taking any action related to the company.


