


- Bitcoin may trade sideways for a long period before hitting 6-figures, an analyst opined.
- The analyst also mentioned that the ETF approval may not lead BTC to a new ATH.
- Bitcoin’s market structure remained bullish and the coin may produce mid-term gains.
CryptoCon, the creator of the Halving Cycles Theory, has revealed that Bitcoin (BTC) might hit $130,000 by December 2025. CryptoCon, who also doubles as a technical analyst, noted that he came to the conclusion using the BitTime model.
On previous occasions, the BitTime model has offered insights into BTC’s movement. A summary of the model aligns with the thought that doubt or bearish bias might sometimes reinforce Bitcoin’s uptrend.
This model was instrumental to Bitcoin’s dominance in 2015. It also had a hand in the coin’s projected increase in the 2019 cycle. According to CryptoCon, the BitTime model has also provided some insights into Bitcoin’s short to mid-term performance.
In his post on X (formerly Twitter), the analyst mentioned that the coin might reach $47,000 or $48,000 soon. However, he also noted that BTC could hit a local top more or less 21 days before or after July 2024 around the same price. After this, CryptoCon disclosed there would be a correction and he expects Bitcoin to trade sideways for a long time before reaching $130,000 in 2025.
CryptoCon’s prediction contradicts a lot of analysts’ projections which seemed to be in favor of a 6-figure BTC price by 2024. While some comments from his posts agreed with the take, others were on the opposing side.
For example, a certain Dos Satoshis told CryptoCon that there could be a shift in Bitcoin’s fundamentals because of the potential ETF approval in Q1 2024. CryptoCon responded by saying that the event might not have a bullish effect on Bitcoin as many would expect.
BTC Stays Dominant
Meanwhile, BTC has stayed atop of market dominance, with its value increasing by 16% in the last seven days. At press time, BTC’s market structure remained bullish. Per the daily BTC/USD chart, there was resistance around $44,000 which pulled the price back to $43,917.
However, the Exponential Moving Average (EMA) showed that BTC is likely to cross the barrier. At the time of writing, the 50 EMA (blue) had crossed over the 200 EMA (yellow). The upward crossover of the 50 EMA through the 200 EMA possesses the potential to establish a new uptrend.
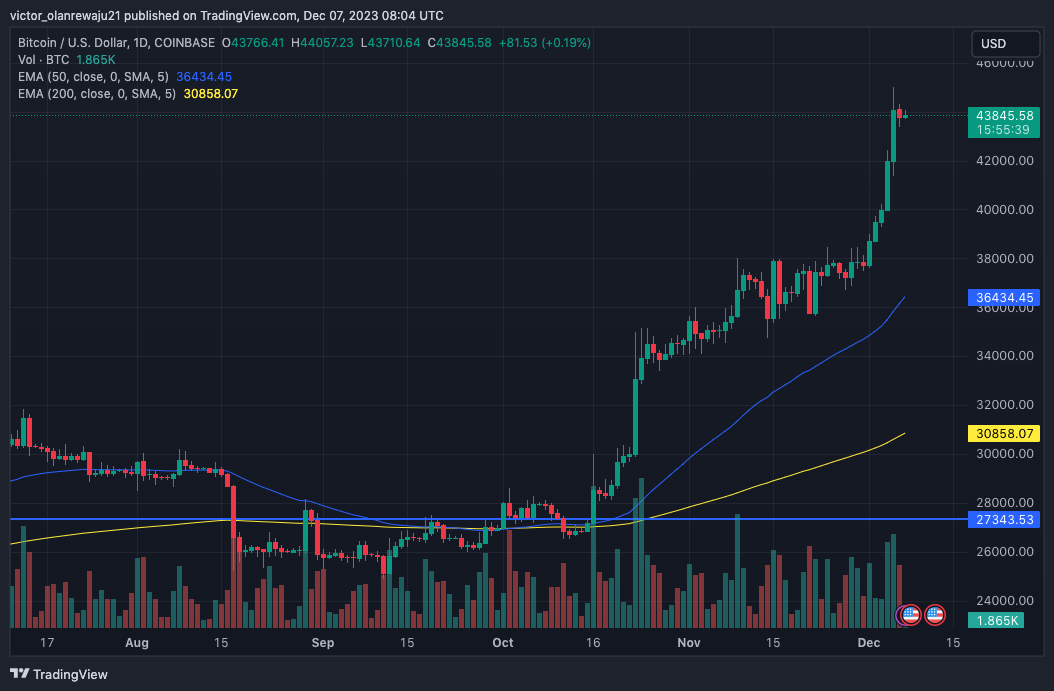
With the current stance, it is likely for BTC to hover around $43,000 and $44,000 for a while. However, there are predictions that the coin may reach $50,000 before the year ends. While that is possible, it would require a surge in buying pressure than what has been seen in recent times.
Disclaimer: The information presented in this article is for informational and educational purposes only. The article does not constitute financial advice or advice of any kind. Coin Edition is not responsible for any losses incurred as a result of the utilization of content, products, or services mentioned. Readers are advised to exercise caution before taking any action related to the company.


