



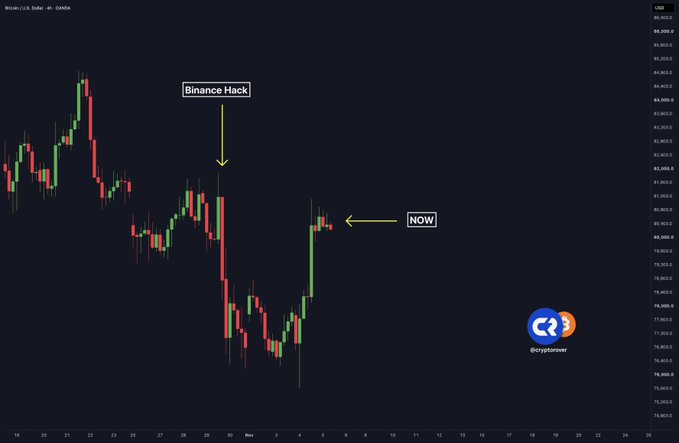
- Bitcoin recovered most of its losses from the $6.3 billion Binance hack within days.
- The Bitcoin Rainbow Chart places BTC in the “Still Cheap” zone below historical fair value.
- BTC support sits near $75,700-$77,700, with resistance around the 365-day moving average at $81,700.
Bitcoin has now almost fully reversed all the losses from the over $6.3 billion Binance hack. The market absorbed one of the biggest cryptocurrency exchange hacks in history in just a few days, highlighting a significant structural shift in the crypto industry.
However, the real importance goes beyond BTC’s price recovery. In previous market cycles, such a significant hack would have probably resulted in a multi-week capitulation across the broader crypto market. This raises an important question: Has Bitcoin demonstrated the maturity and resilience needed to sustain its long-term bull-market trajectory?
Bitcoin Market Cycle: What the Wall Street Cheat Sheet Reveals About Investor Sentiment
Bitcoin has rebounded aggressively to around $79,700, almost entirely reversing its losses from the historic $6.3 billion cyberattack on Binance. The market absorbed what is being called the largest crypto heist in history in just a matter of days.
Meanwhile, Bitcoin’s recent price action mirrors the classic Wall Street Cheat Sheet of market cycle psychology. Following the short-term holder supply in profit peaking around the extremely optimistic level in early October 2026, the market began to fall into a corrective mode.
The nearly 10% correction from the September peaks, alongside Binance’s hack and U.S. midterm results in late October, pushed that profit ratio to around 38%, as per Glassnode’s recent weekly on-chain report.
This shift reflects the Cheat Sheet’s shift from Euphoria and Complacency to Anxiety, Denial, and Fear. Speculative leverage was largely flushed; short-term holders went overwhelmingly “underwater”; sentiment indicators fell into Fear territory, with readings as low as 26-34 in early November.
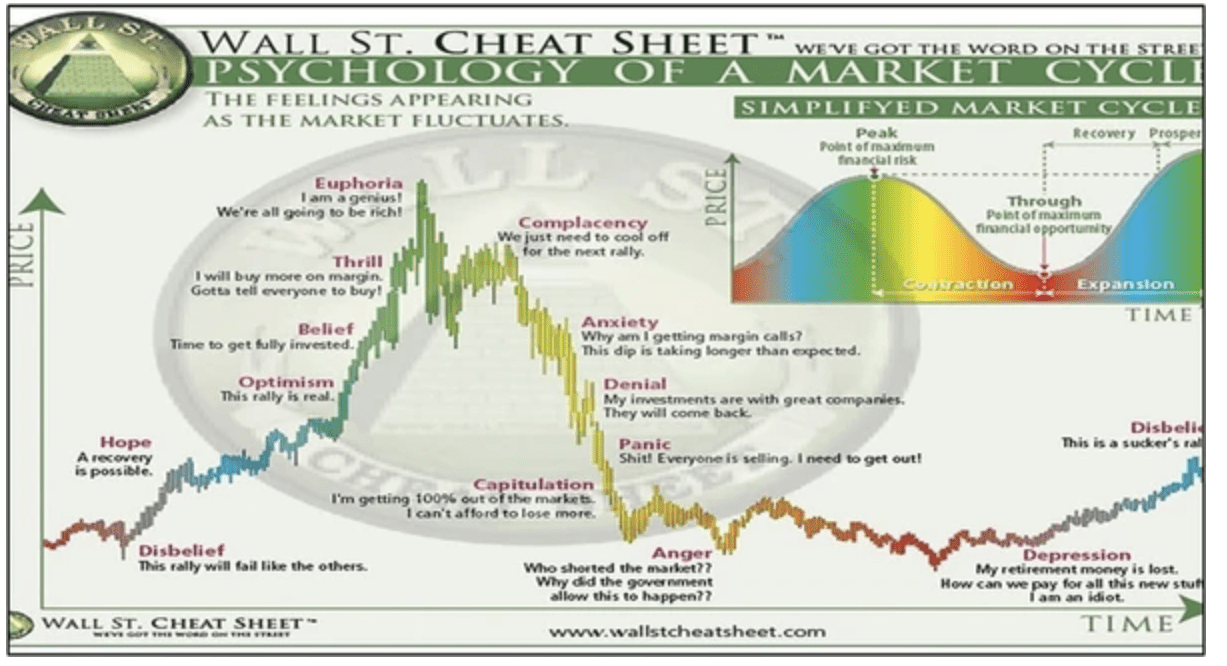
That said, the swift recovery, with the multi-billion-dollar exchange incident being absorbed within days, rather than weeks, suggests a stronger underlying demand and a shorter negative emotional period than previously.
In addition, current positioning remains in a post-correction stabilization zone, though price is starting to find early signs of Hope as the Crypto Fear & Greed Index is returning to Neutral territory at 41.
Follow us on X for real-time crypto updates.
CoinGlass Bitcoin Rainbow Chart: Where Is BTC in the Market Cycle, and Is It Undervalued?
With Bitcoin trading at $79,756.94, the CoinGlass Bitcoin Rainbow Chart places BTC in the lower-middle portion of its long-term logarithmic growth channel. It fits into the light-green “Still Cheap” zone below the yellow “HODL!” zone, which marks the historical fair-value level of the chart.
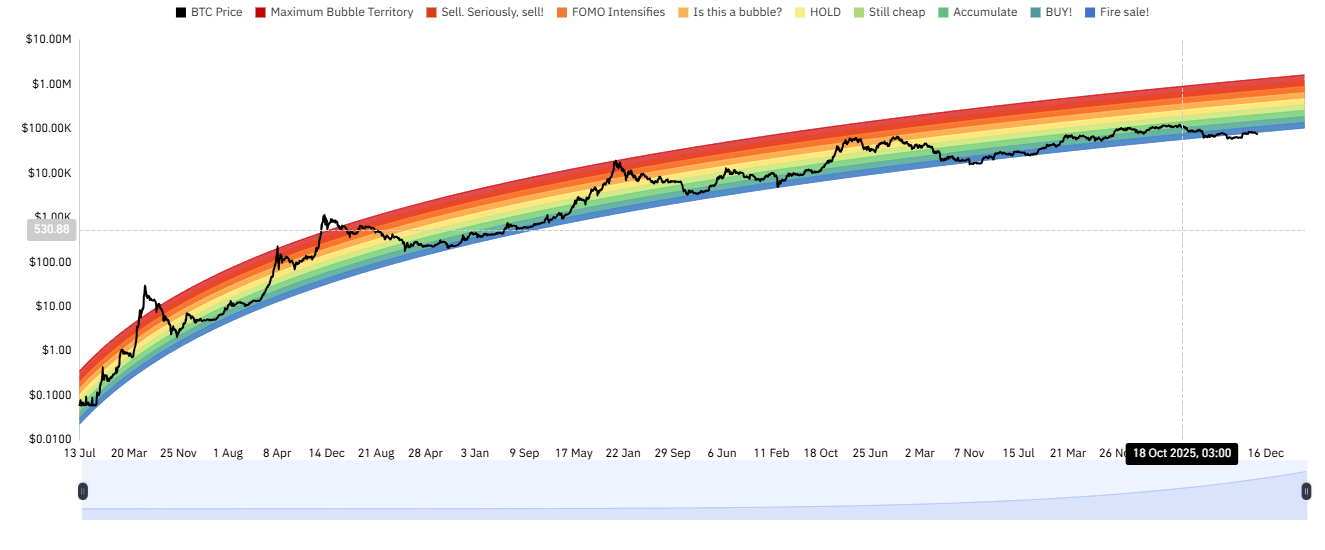
This positioning suggests that Bitcoin is moving out of its deepest undervaluation zones, such as “Fire Sale” and “BUY!”, but has yet to enter the orange and red overvaluation bands, including “Is This a Bubble?”, “FOMO” and “Maximum Bubble”. In the past, these top bands have coincided with greater speculation and late-cycle market exuberance.
In other words, Bitcoin is not trading at extreme historical discounts, nor is it exhibiting valuations like those that are usually seen near big market cycle peaks. This places BTC in a relatively moderate valuation zone, potentially offering an attractive environment for long-term investors, although further downside remains possible.
BTC Price Outlook: Accumulation Opportunity or Further Downside Ahead?
Bitcoin’s key support levels are the short-term holder cost basis near $75,700 and True Market Mean around $77,700. Resistance is close to the 365-day moving average at $81,700. On-chain metrics indicate that conditions have been improving, with leverage being washed out, short-liquidation clusters hovering at $87,000, and significant downside absorption. However, recent U.S. spot Bitcoin ETF outflows remain a concern.
A break below $75,000–$76,000 could expose BTC to further downside. However, the current leverage flush, quick recovery from the Binance shock, and the fact that valuation is still not at “overheated” levels indicate that this could be more of an opportunity to accumulate than a fresh bear phase in the market, provided that critical technical levels hold.
Subscribe to our YouTube channel for the latest crypto news.
Related: Bitcoin Price Is Ignoring Bad News: Are Political Headlines Losing Their Power Over BTC?
Disclaimer: The information presented in this article is for informational and educational purposes only. The article does not constitute financial advice or advice of any kind. Coin Edition is not responsible for any losses incurred as a result of the utilization of content, products, or services mentioned. Readers are advised to exercise caution before taking any action related to the company.