


- Bitcoin shared its price variation during the last five years in a tweet.
- On December 13, BTC had the same price as it had five years ago.
- The RSI Index is based at 68.29 and is tilted upwards, BTC could enter the oversold region.
Bitcoin’s official Twitter account shared its performance in the recent five years. As per the tweet, BTC had no change in price as it was trading at $17,428, the same price it traded back on December 13, 2017.
However, that doesn’t mean that BTC did not have any action during the past five years. As shown the in the tweet above, BTC has been trading under $17,000 since July 2017 up until late 2020. But come 2021, the price of BTC skyrocketed to approximately $60,000. Additionally, there was a second hump, as denoted in the graph, toward the latter part of 2021.
As shown in the monthly chart below, BTC’s price fluctuated with a large bandwidth during the second half of November. It hit a maximum of $17k and tanked to its lowest of $15,647. BTC showed a greater range when in the red zone than the green zone depicting that the fall in price was greater than the rise in price.
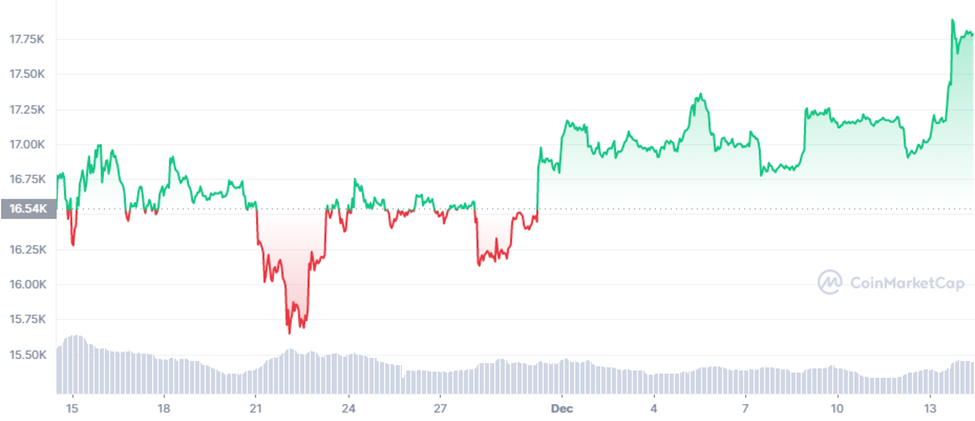
However, since the beginning of December, BTC has been trading in the green zone and has been able to trade above $16,500.
Meanwhile, BTC has been trading in a bullish Regression Channel, as shown in the chart below. As of press time, BTC is trading at $17,791 and is up by 3.65% in the last 24 hours.
On numerous occasions, BTC tested the upper line on the regression channel. Despite breaking the upper limit on a few occasions, it could not retain its position.
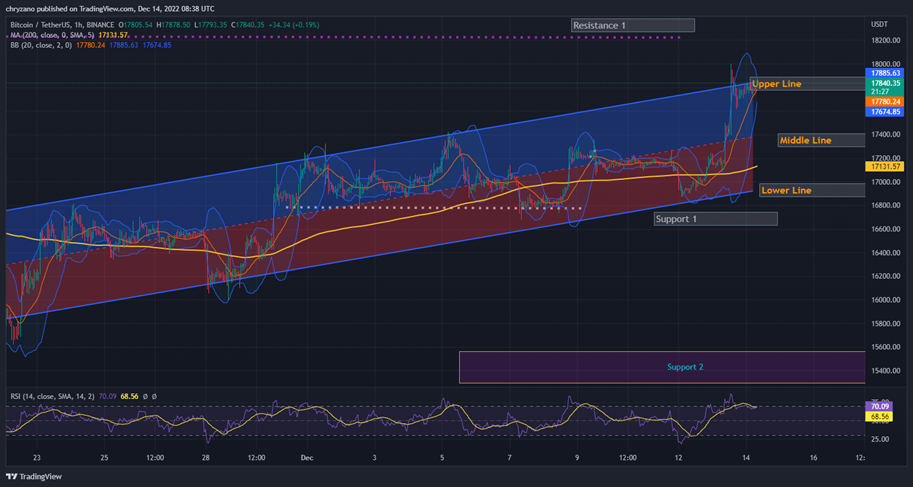
Notably, BTC tested the lower line of the regression channel on a couple of occasions; however, it was able to gain some momentum and recover. Much of BTC’s action has been with the middle line where it kept rebounding.
The Bollinger bands are contracting; hence there could be less volatility in the future. Moreover, the Relative Strength Index (RSI) at 68.29, is titling upwards and could hit 70, which is the oversold region.
Disclaimer: The views and opinions, as well as all the information shared in this price analysis, are published in good faith. Readers must do their own research and due diligence. Any action taken by the reader is strictly at their own risk, Coin Edition and its affiliates will not be held liable for any direct or indirect damage or loss.
Disclaimer: The information presented in this article is for informational and educational purposes only. The article does not constitute financial advice or advice of any kind. Coin Edition is not responsible for any losses incurred as a result of the utilization of content, products, or services mentioned. Readers are advised to exercise caution before taking any action related to the company.
 Price Prediction 2026, 2027, 2028, 2029, 2030-2050")


