






- Bitcoin’s technical indicators have aligned to suggest a potential bullish reversal.
- Sell pressure that was prevalent across Bitcoin timeframes is beginning to fade.
- Renewed US-Iran tensions and institutional buying are supporting Bitcoin’s new trend.
Bitcoin is trading above $63,000 after rebounding from last weekend’s pullback that extended into Monday. The price defended the $60,000 support level, which has evolved into a historical landmark for the flagship cryptocurrency.
Bitcoin’s Technical Structure
Beyond current price conditions, Bitcoin’s technical structure reflects a change, suggesting the cryptocurrency could be preparing for an eventual reversal. Notable indicators on the Bitcoin weekly chart have aligned, confirming the early signals observed on the lower timeframes.
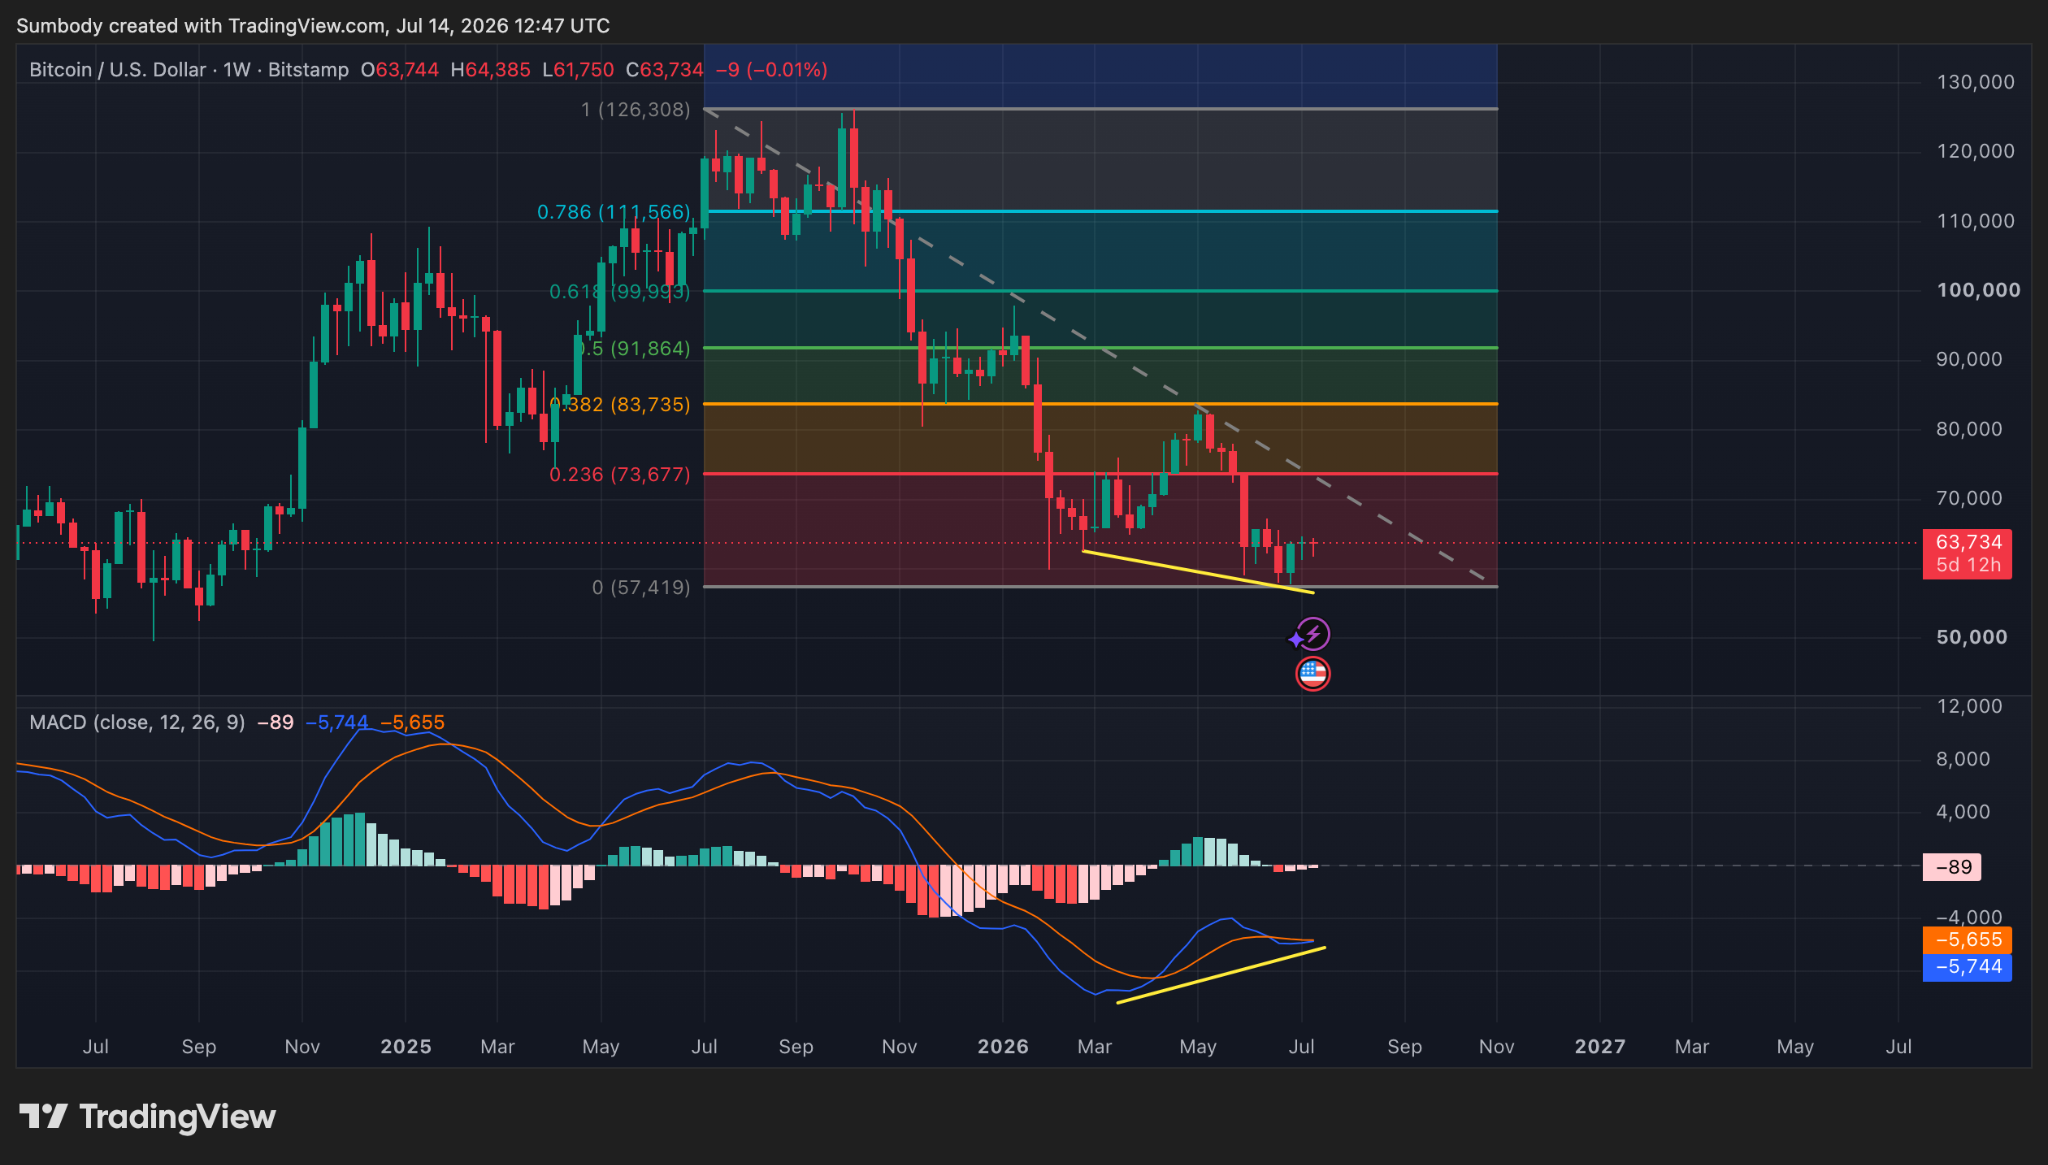
Bitcoin’s momentum indicator, Moving Average Convergence Divergence (MACD), currently reflects a clear divergence on Bitcoin’s weekly chart. This signal aligns with the cryptocurrency’s price action since dropping below $58,000 at the end of June.
A confirmed BTC reversal from the current price region would target $73,500, the next notable resistance, which coincides with the 0.236 Fibonacci retracement on the weekly chart. However, the price would first have to contend with the $70,000 psychological level.
BTC Sell Pressure is Fading
It is worth noting that the selling pressure on Bitcoin is fading. The price structure across the BTC chart timeframes reflects a drop in trading volume, particularly since the beginning of July. This aligns with Glassnode’s on-chain data, which shows Bitcoin’s daily net selling pressure dropped from 2000 BTC in June to 53 BTC in July.
The current trend suggests long-term BTC holders are steadily transferring supply to new buyers. With the spot cumulative volume delta remaining negative, the current BTC bounce is likely driven by derivatives traders, rather than spot accumulation.
Key Fundamental Drivers
In the meantime, the two fundamental drivers supporting the newlook Bitcoin trend are the renewed geopolitical tensions between the US and Iran and the return of institutional BTC demand. Renewed aggression in the Middle East has sparked inflation fears, pushing the US Dollar Index higher, while spot Bitcoin ETF inflows accumulated nearly $197 million in the past week.
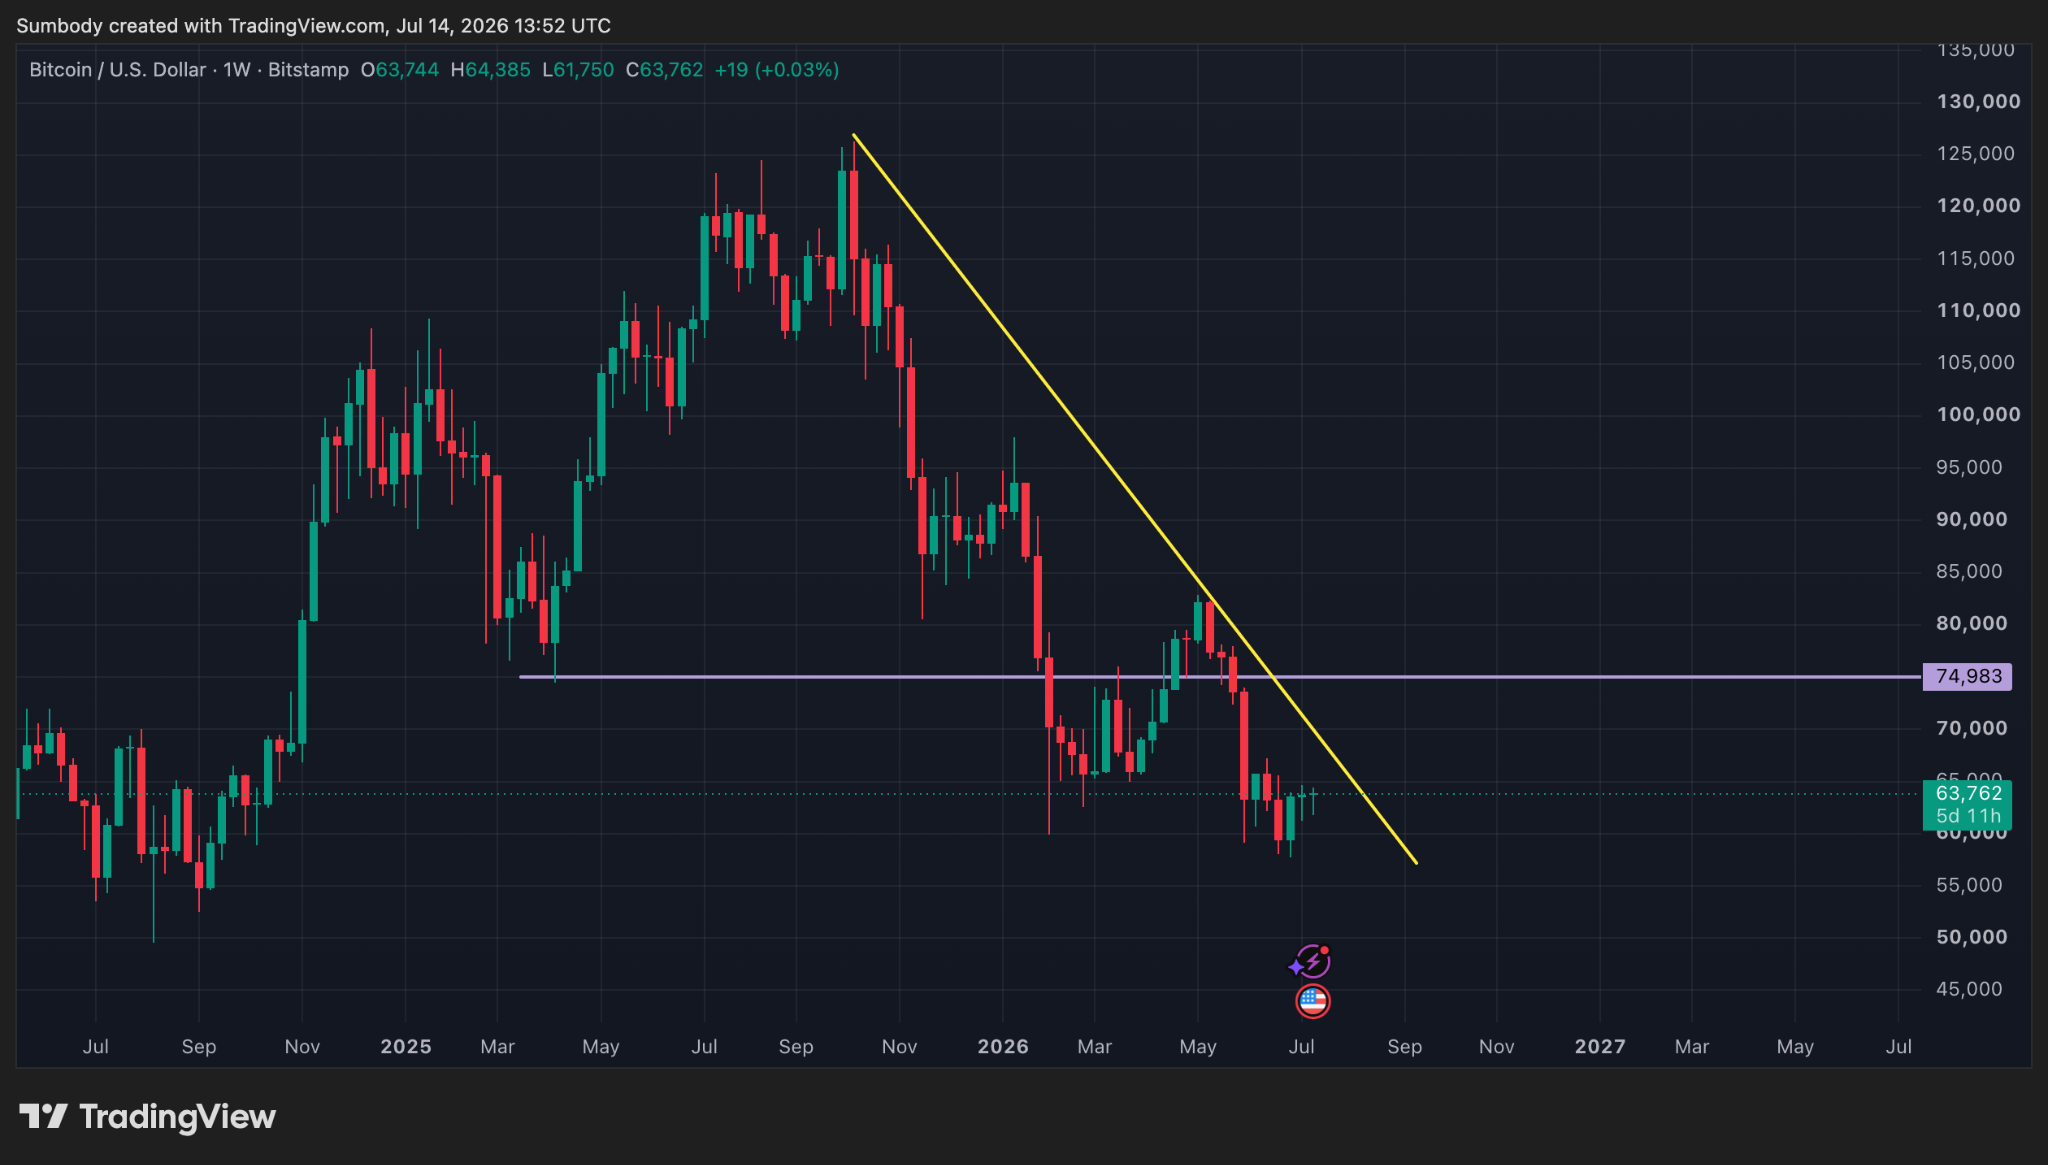
Meanwhile, a confirmed return of bullish momentum for Bitcoin would require buy-in from spot traders and an industry-wide reversal of sentiment. Bitcoin may need to break above the $75,000 to achieve this, before opening the way to higher price targets and discussions about a return to the $100,000 region.
Related: Bitcoin Rally Stalls: Glassnode Flags Thin Liquidity and Weak Demand
Disclaimer: The information presented in this article is for informational and educational purposes only. The article does not constitute financial advice or advice of any kind. Coin Edition is not responsible for any losses incurred as a result of the utilization of content, products, or services mentioned. Readers are advised to exercise caution before taking any action related to the company.




