


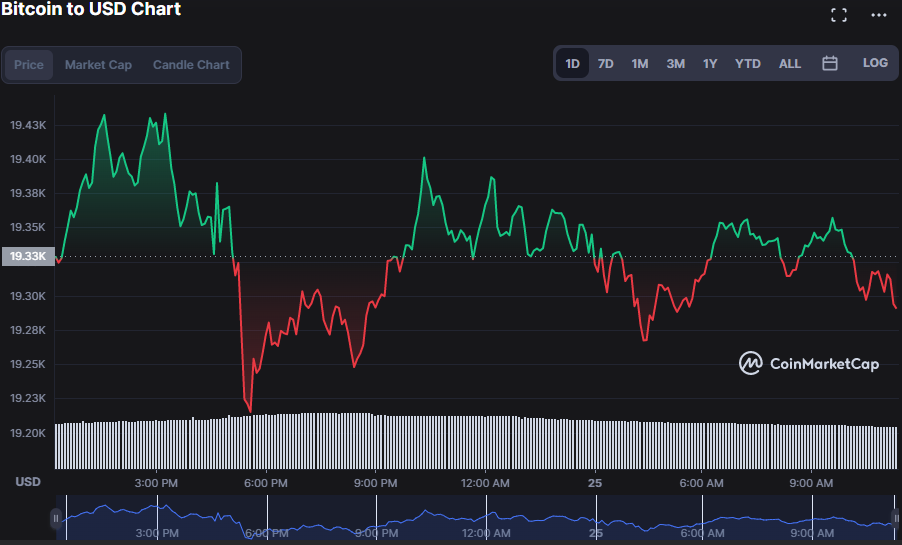
 Dips to Intra-day Lows of $19,292.70 by 0.53%")
- On the previous day, the price of Bitcoin fell by 0.61% to $19,284.34.
- Bulls need to battle to invalidate the current bearish trend in the BTC market.
- BTC faces significant resistance at $19,434.24.
According to the latest Bitcoin price analysis, the coin has been in a downtrend during the last few hours. BTC encountered severe resistance after achieving its 24-hour high of $19,435.02. Due to the market’s dip, BTC is currently valued at $19,307.18.
The market capitalization decreased by 0.53% to $370,484,070,150, and the 24-hour trading volume decreased by 20.03% to $23,903,446,743, which may be the cause for the drop in BTC prices.
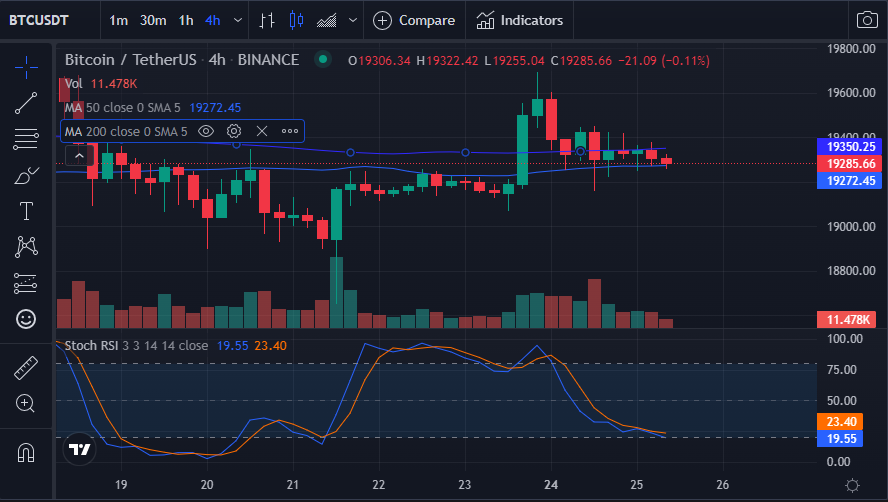
The Stoch RSI is oversold and pointing south with a reading of 18.15. This reading indicates a higher likelihood that the virtual currency‘s negative trend will continue. However, it also suggests that the current market trend is ending and prices may return to their previous levels, so traders should be cautious.
The 50-day Moving Average crosses below the 200-day Moving Average on the 4-hour Price Chart, signaling a bearish crossover. Specifically, the 200 MA touches at $19272.47, and the 50-day MA touches at $19350.24.
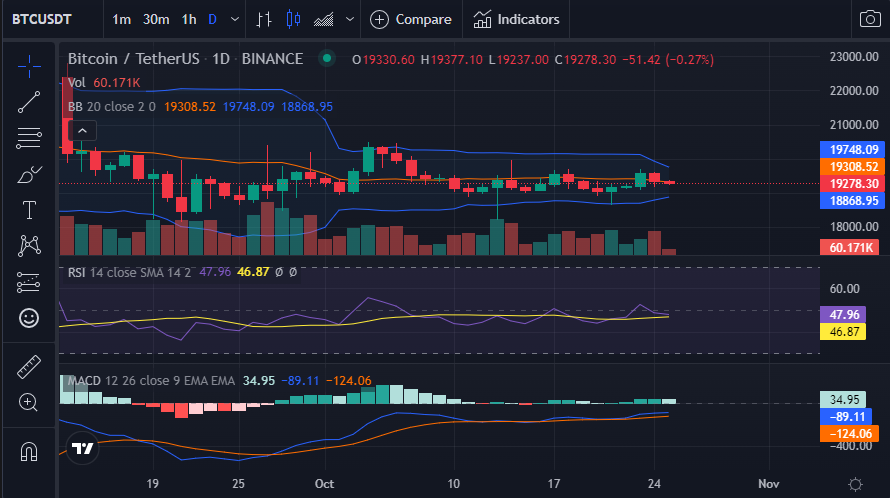
The Bollinger Bands’ upper and lower bands are touching at $19747.52 and $18867.40, respectively. This suggests a narrowing of the Bollinger bands, which denotes a reduction in market volatility, as shown by the BTC 1-day trading volume.
The RSI is pointing south and has a value of 47.42. The market suggests that buying and selling are distributed equally at this level. If the bears control the market, the RSI score going south may enter the oversold zone.
The histogram is in the positive region, and the blue MACD line is well above the signal line. However, the MACD has a value of -89.18 in the negative territory. The histogram on the positive zone and MACD above the signal line indicates bullish momentum, suggesting that the bearish momentum may only last for a short spell.
The bulls must continue to drive higher prices and hold the barrier level to nullify the current bearish trend.
Disclaimer: The views and opinions, as well as all the information shared in this price analysis, are published in good faith. Readers must do their own research and due diligence. Any action taken by the reader is strictly at their own risk, Coin Edition and its affiliates will not be held liable for any direct or indirect damage or loss.
Disclaimer: The information presented in this article is for informational and educational purposes only. The article does not constitute financial advice or advice of any kind. Coin Edition is not responsible for any losses incurred as a result of the utilization of content, products, or services mentioned. Readers are advised to exercise caution before taking any action related to the company.


