


- Bitcoin faces pressure after the Oct. 10 flash crash erased $19B in leveraged crypto bets.
- Past FIFA World Cup cycles in 2014, 2018, and 2022 aligned with weaker crypto market phases.
- Bitcoin’s 200-week moving average may decide whether $59,100 can hold as cycle bottom.
Bitcoin is facing another major test as the current downturn is being compared with earlier FIFA World Cup-year bear markets. The pressure follows an Oct. 10 flash crash that erased $19 billion in leveraged crypto positions in one afternoon and dragged major tokens lower.
The selloff pushed Bitcoin down from its $126,000 peak to $105,000. Ethereum, Solana, XRP, and several other large cryptocurrencies also declined during that move.
Bitcoin World Cup Pattern Raises Bear Concern
However, the market comparison comes from earlier FIFA World Cup cycles that also unfolded during weak crypto periods. In 2014, Bitcoin entered the tournament near $620 and ended around $580, as the market was still dealing with the 2013 bubble and the Mt. Gox collapsed.
A similar pattern appeared in 2018, only months after BTC peaked near $20,000. During that tournament, the asset fell from around $6,800 to below $6,000 before recovering slightly, while the wider market remained inside a crypto winter.
The 2022 FIFA World Cup also arrived during a damaged market phase. The tournament began shortly after the collapse of FTX, when Bitcoin traded between $16,000 and $18,000 and industry sentiment remained under pressure.
The three examples have drawn market attention to whether the latest cycle could follow the same path. This year may either mirror the previous three FIFA World Cups periods or break from that pattern.
Bitcoin Bottom Signals Take Focus
However, in an X post, analyst Ash Crypto said Bitcoin dropped 14% last week after breaking down from an ascending channel. The analyst said the latest structure looks similar to the 2022 bear market, when BTC bottomed after a 78% decline.
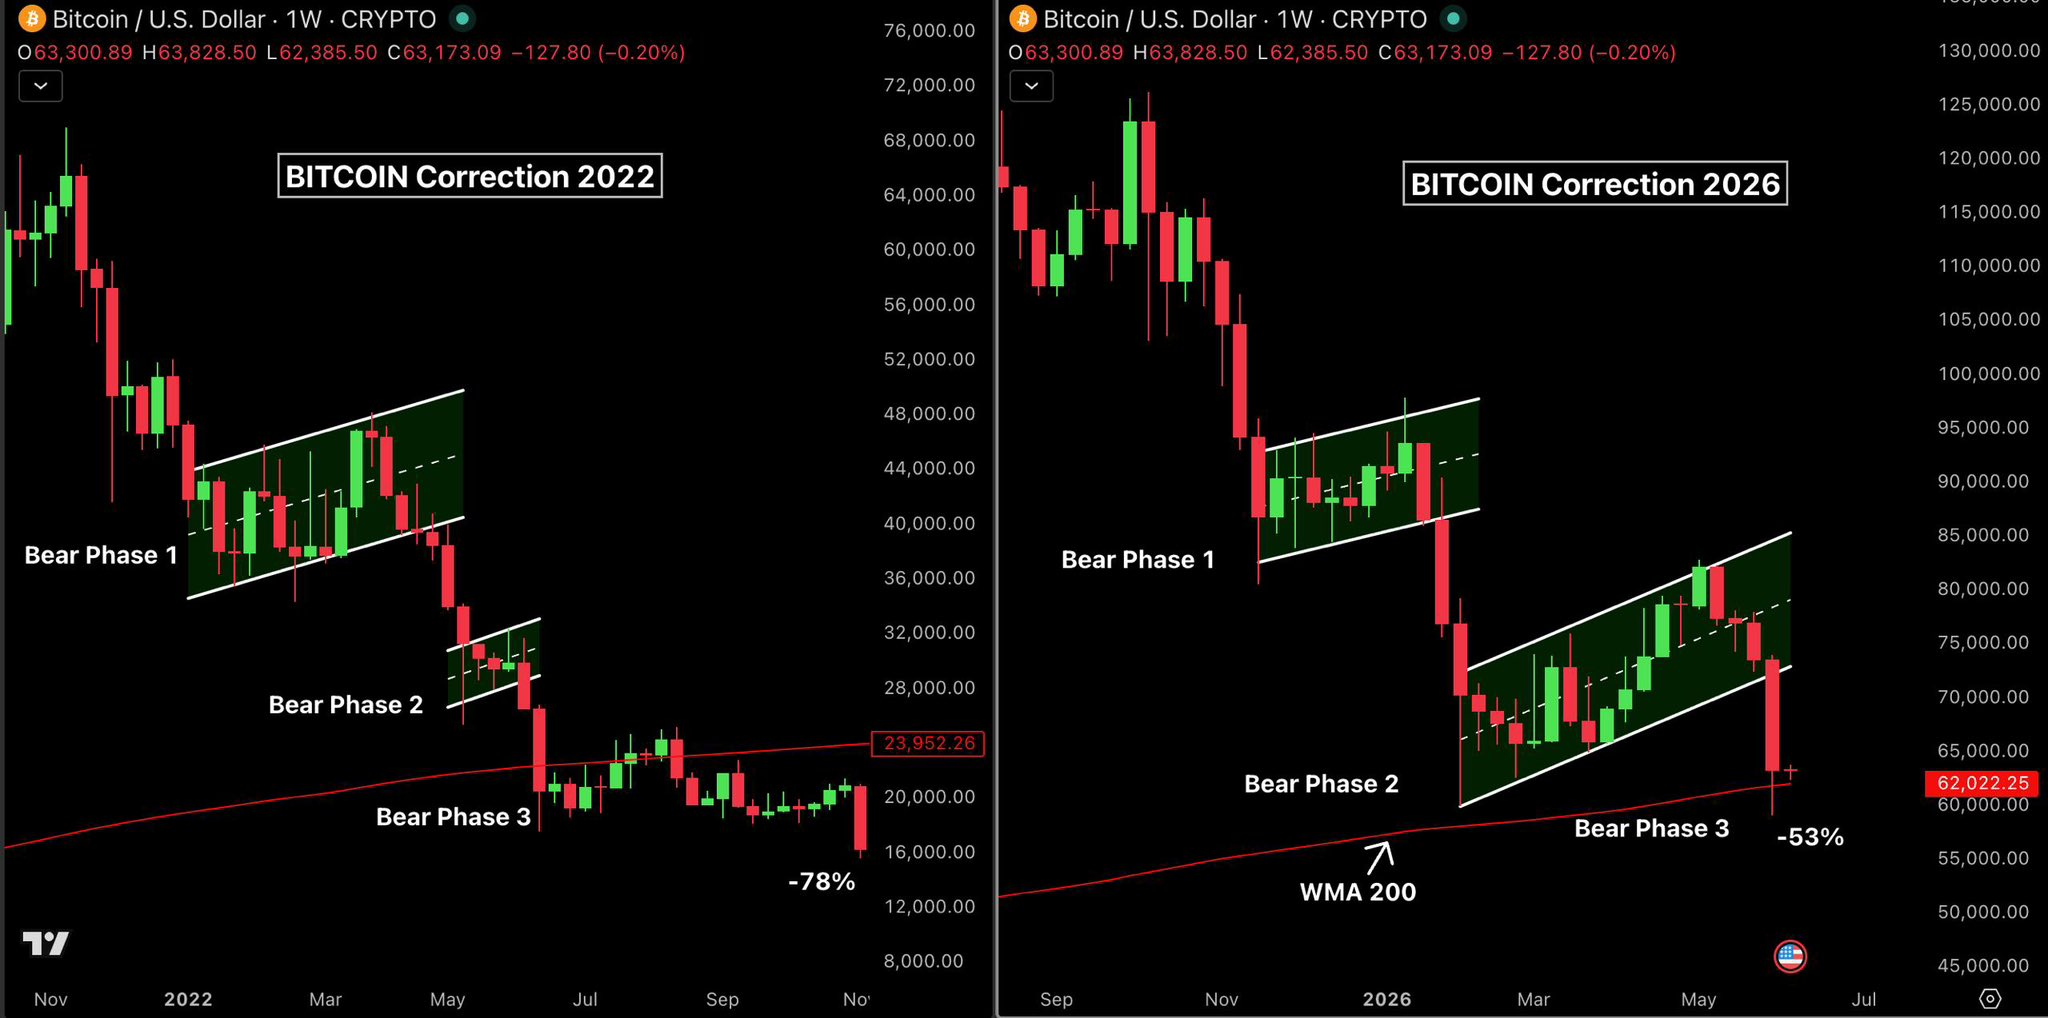
Source: X
This cycle’s correction has reached 53% so far. However, according to the analyst, the weekly 200 moving average is now the main level to watch. BTC found strong support there twice in the past three cycles.
Ash Crypto said a hold above the 200-week moving average could place the cycle bottom near $59,100. In earlier cycles, Bitcoin also bottomed almost one year after the bull-market top, which would point to October 2026 if the timing repeats.
The analyst also cited the death cross as a deeper risk signal. Past Bitcoin corrections after that pattern exceeded 60%, which would place a possible bottom near $39,000.
For now, the market focus remains on whether buyers defend the 200-week moving average. A loss of that level could open the way toward $50,000 or lower, while a hold may support the bottoming case.
Related: Buying the Dip: Why Saylor’s $101 Million Bet Defies the Bear Market
Disclaimer: The information presented in this article is for informational and educational purposes only. The article does not constitute financial advice or advice of any kind. Coin Edition is not responsible for any losses incurred as a result of the utilization of content, products, or services mentioned. Readers are advised to exercise caution before taking any action related to the company.


 Price Prediction 2026, 2027, 2028, 2029, 2030-2050")

