



- BLESS surged 59.33% weekly, breaking above all four major daily EMAs.
- Open interest rebounded to $30.98 million, signaling renewed derivatives participation.
- Positive spot netflows of $51,870 on October 30 suggest improving buying interest.
Bless (BLESS) has gained significant market attention after extending its rally over the past week. The token has climbed 59.33% in seven days, while its latest 24-hour gain reached 31.76%. BLESS now trades around $0.01285, with daily trading volume exceeding $12.67 million. The rally has also pushed its market capitalization to approximately $23.66 million.
BLESS Breakout Places $0.01281 Resistance in Focus
BLESS has broken above its major daily exponential moving averages (EMAs), strengthening its bullish technical outlook. The price now trades above the 20, 50, 100, and 200-day EMAs. This development suggests buyers have regained control after an extended consolidation period.
However, the token faces immediate resistance around $0.01281. This level aligns with the 0.786 Fibonacci retracement and represents an important breakout barrier. A sustained move above this zone could encourage additional buying activity.
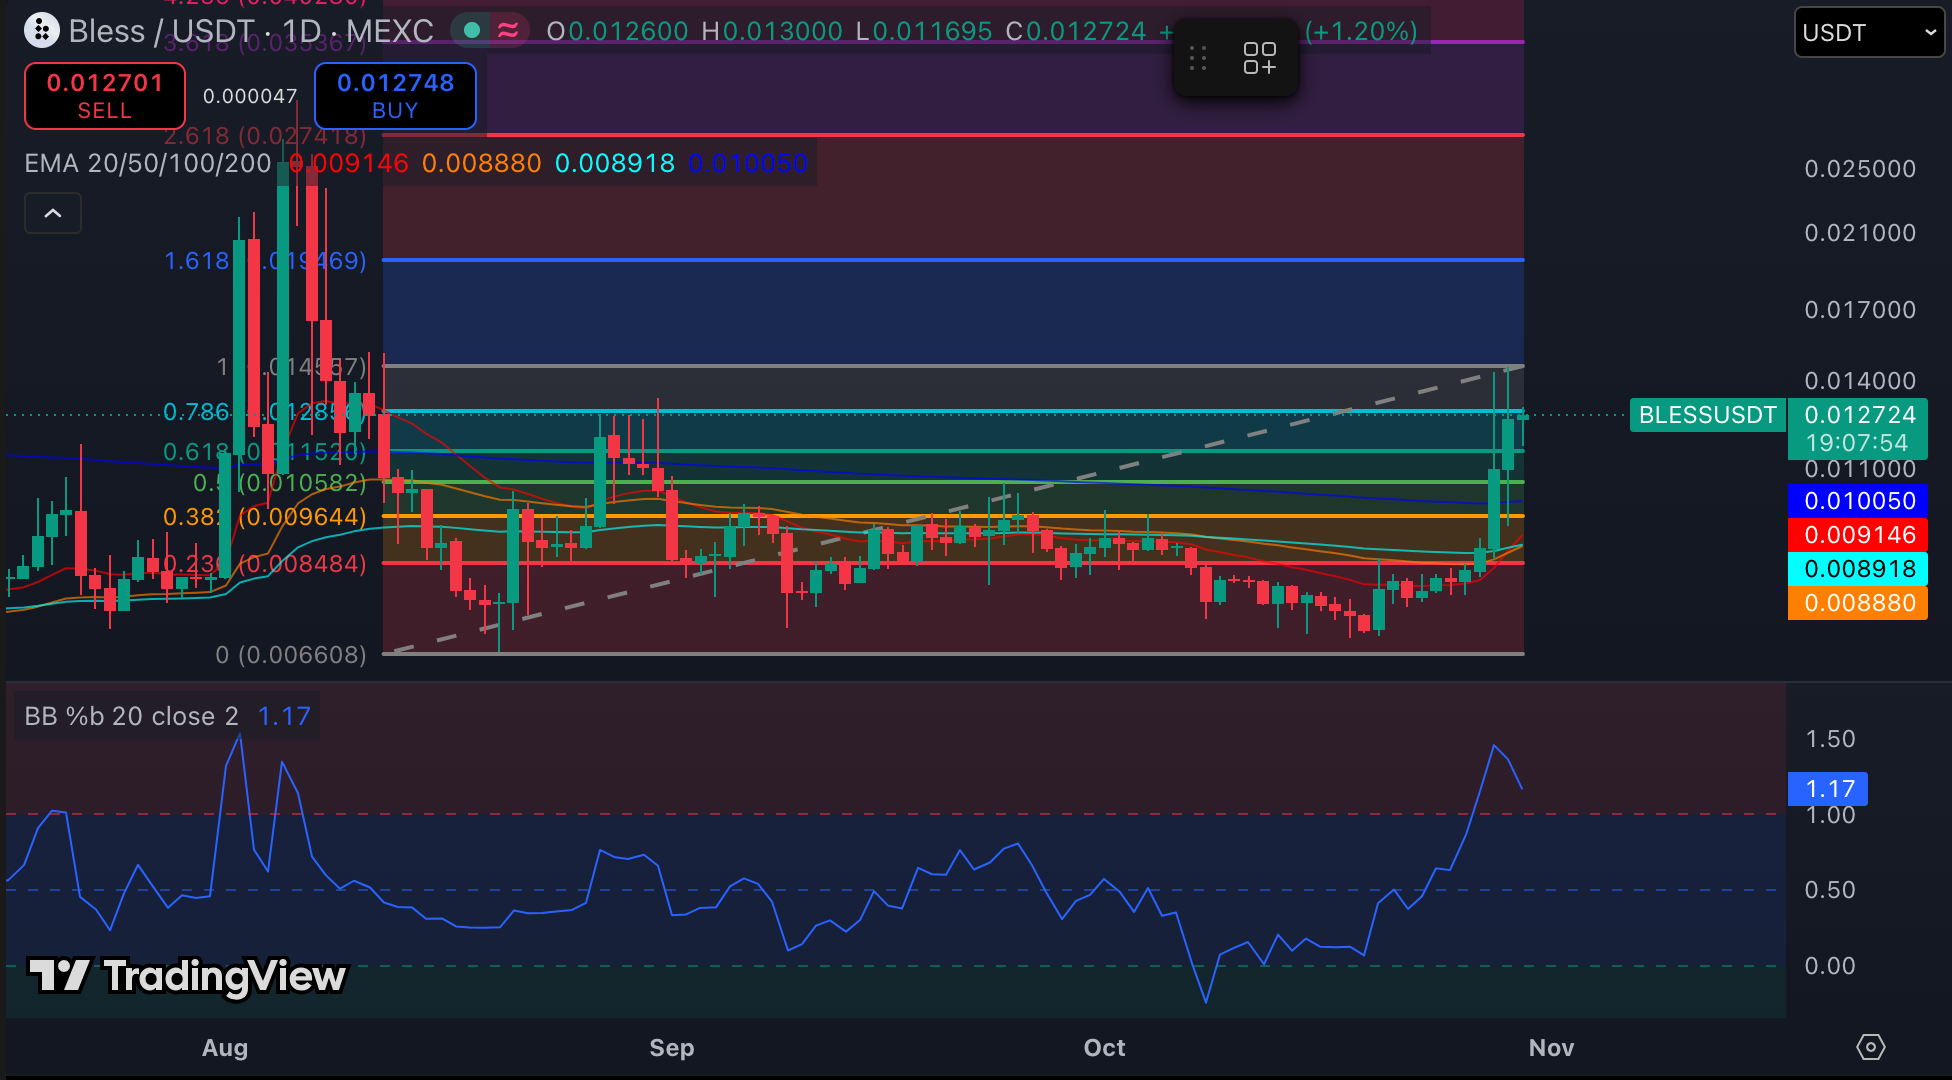
Significantly, the next major upside target stands near $0.01459. This level corresponds with the previous swing high and the 1.0 Fibonacci retracement. A successful breakout could therefore give BLESS another opportunity to extend its recovery.
On the downside, $0.01154 provides the first important support level. The 200-day EMA near $0.01005 offers another reference point if selling pressure increases. Hence, maintaining these levels remains important for preserving the current bullish structure.
Related: JUST (JST) Price Prediction & Forecast 2026, 2027, 2028, 2029, 2030
Meanwhile, the Bollinger Bands %B indicator has climbed to 1.17. This reading places BLESS above its upper Bollinger Band. Although this reflects strong buying pressure, it also suggests an overstretched rally. Consequently, short-term profit-taking could interrupt the upward movement.
Rising Open Interest Signals Renewed Trader Participation
Derivatives activity provides another perspective on BLESS’s recent price performance. Open interest remained relatively steady between $15 million and $22 million throughout May and July.
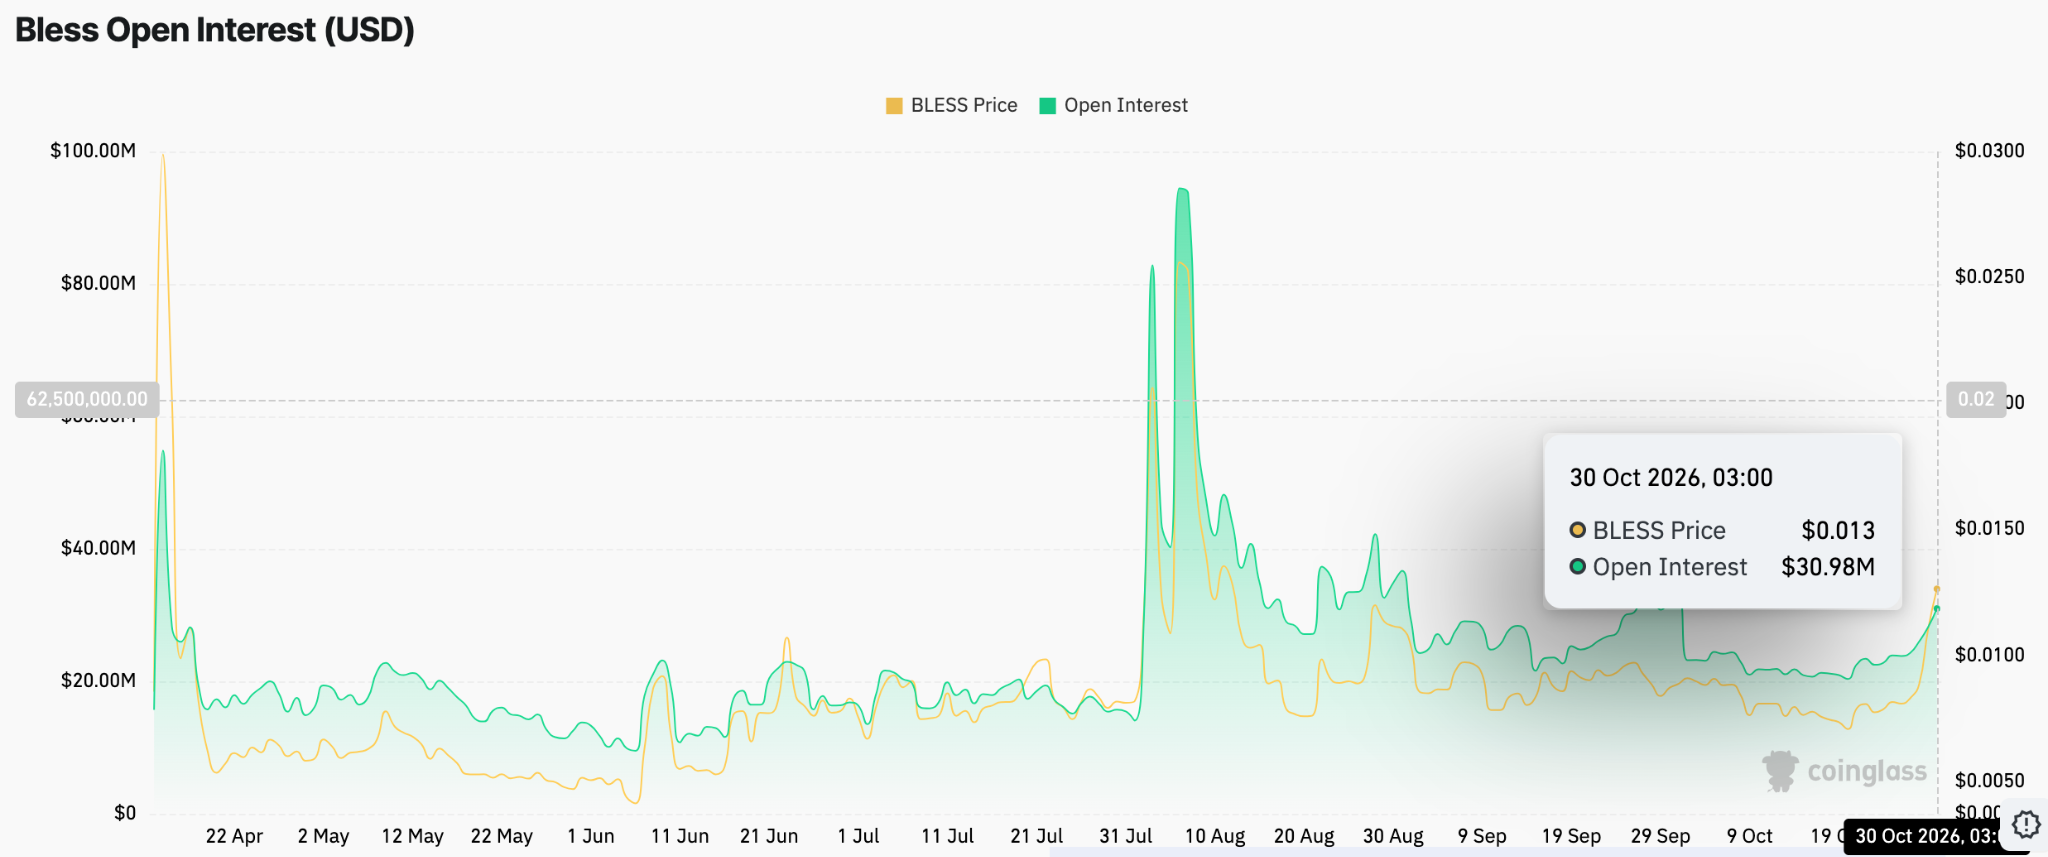
However, activity accelerated sharply in early August. Open interest briefly approached $94 million as traders increased their exposure. The subsequent decline toward $30 million indicated widespread position closures.
Throughout September and October, open interest mostly fluctuated between $20 million and $35 million. Recent figures show another increase, reaching approximately $30.98 million.
Positive Spot Flows Support the Recovery
Spot market activity also shows signs of improving conditions. BLESS experienced considerable inflow and outflow fluctuations throughout the year.
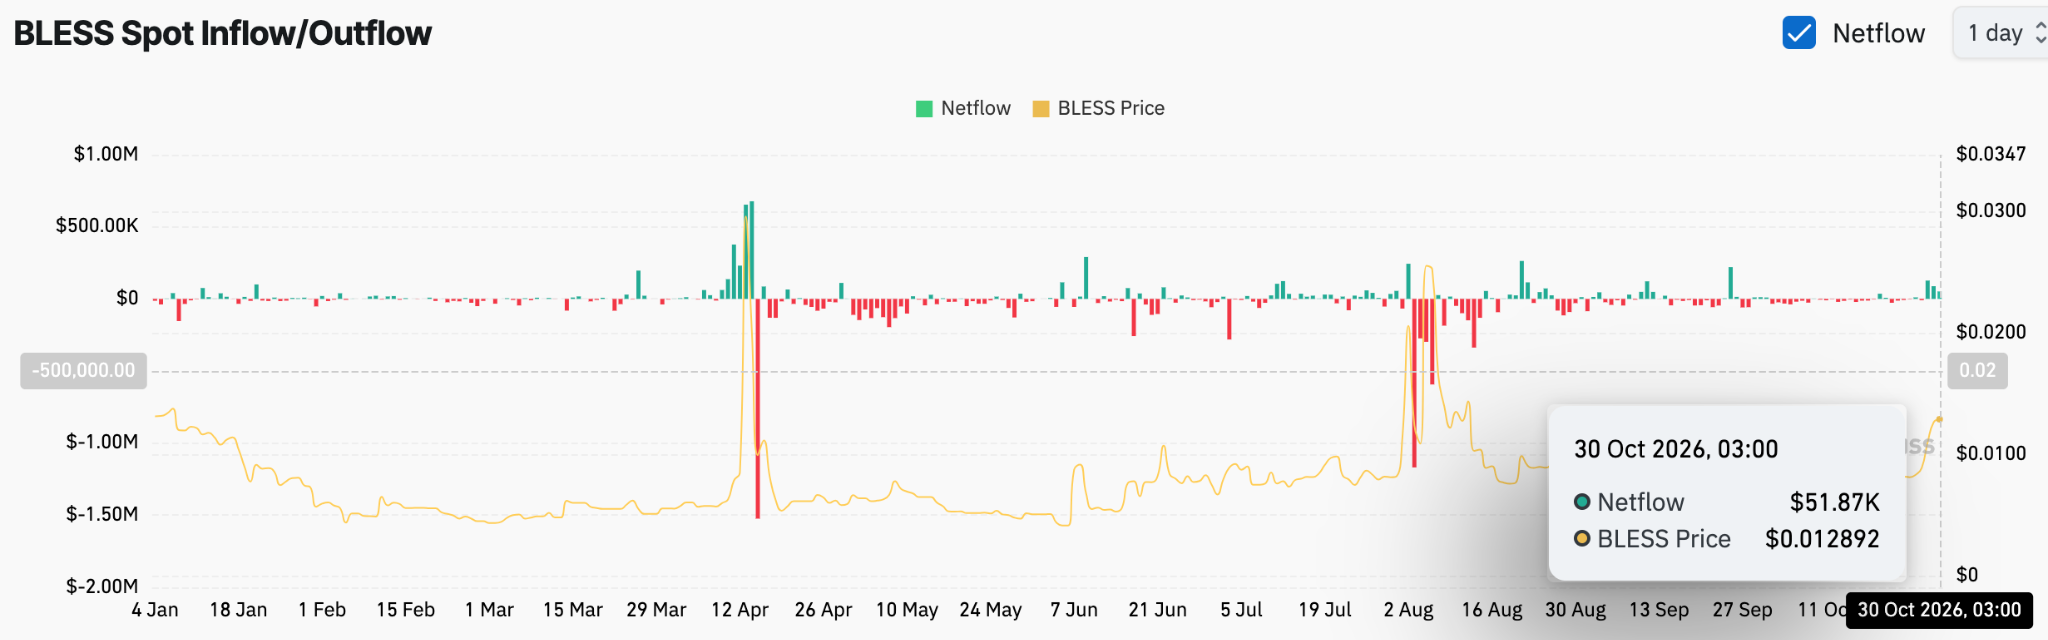
April recorded inflows exceeding $600,000 before outflows surpassed $1.5 million. Selling pressure continued into May, while June and July showed relatively calmer activity.
August introduced another period of volatility, with outflows exceeding $1 million. September and October subsequently displayed more balanced trading activity.
Moreover, the latest figures recorded positive netflows of $51,870 on October 30. BLESS traded around $0.012892 during this period. This development suggests renewed buying interest, although sustained accumulation remains unconfirmed.
Technical Outlook for Bless (BLESS) Price
Key levels remain well-defined as BLESS maintains its bullish breakout:
- Upside levels: $0.01281 represents immediate resistance. A breakout could push BLESS toward $0.01459, its next major resistance and previous swing high.
- Downside levels: $0.01154 serves as initial support, followed by the $0.01005 level near the 200-day EMA.
- Resistance ceiling: $0.01281 (0.786 Fibonacci level) remains the immediate barrier. Clearing this level could strengthen medium-term bullish momentum.
- Momentum indicator: Bollinger Bands %B stands at 1.17, indicating overbought conditions and increased short-term correction risks.
Will BLESS Go Up?
BLESS price prediction hinges on whether buyers can sustain momentum above $0.01154 and overcome resistance at $0.01281. The recent 59.33% weekly gain, rising open interest, and positive spot netflows support the bullish outlook. If buying pressure continues, BLESS could advance toward $0.01459.
However, failure to maintain support could trigger profit-taking toward $0.01005. For now, BLESS retains a bullish structure, but sustained inflows and a confirmed resistance breakout will determine its next move.
Disclaimer: The information presented in this article is for informational and educational purposes only. The article does not constitute financial advice or advice of any kind. Coin Edition is not responsible for any losses incurred as a result of the utilization of content, products, or services mentioned. Readers are advised to exercise caution before taking any action related to the company.