



A Bitcoin breakout may appear on Binance, but it might not appear on a forex brokerage’s MT5 chart. Ethereum may also create bullish and bearish candles on separate trading platforms. The charts on both platforms could have different prices, trading instruments, and candle closing times for the same cryptocurrency.
The differences are important as they are the basis for traders to use candlesticks to identify breakouts, liquidity sweeps, support levels, and possible reversals. A slight variation in the upper or lower level can alter the trader’s analysis of the setup. But these are not all bad news when it comes to the price of candles.
This is typically because the approach used by each platform for fetching prices and structuring the market into candles is different in nature. Looking across the provided 5-minute forex chart analysis and the four-hour Binance charts reveals the importance of traders verifying such aspects before taking the decision to confirm signals.
BTCUSD and BTCUSDT Can Record Different Prices
BTCUSD means that the price of Bitcoin is in the U.S. dollar. BTCUSDT means that the price of Bitcoin is in Tether. The idea behind USDT is to keep its value pegged to the US dollar, though the two are not the same. Therefore, there may be a slight variation in exchange rates, especially in times of market volatility.
Also, the source of each quote is important. A forex broker may provide Bitcoin in a contract for difference (CFD), or Binance may have a spot market in addition to a derivatives market. There are different participants in each market, liquidity in each market, and trading activity in each market. The prices that are ultimately achieved, therefore, may vary even if the instruments follow Bitcoin.
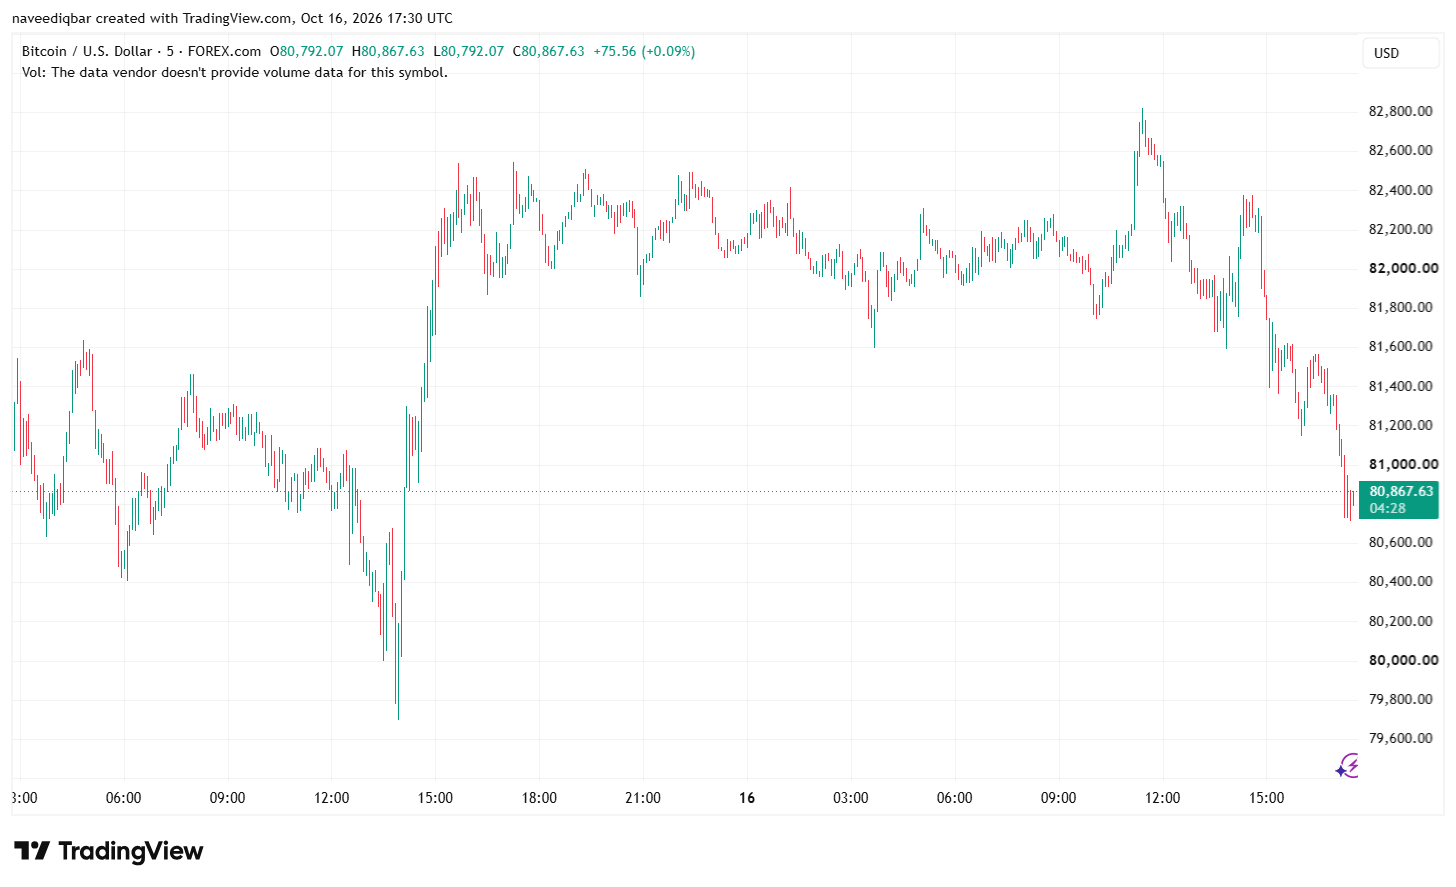
The supplied five-minute BTCUSD analysis records an early range of approximately $80,400 to $81,600. Bitcoin then fell below $79,800 before recovering above $82,000 and reaching roughly $82,800. The analysis later records a retreat to $80,867.63. This sequence shows how a single session can contain sharp reversals that affect candle shapes.
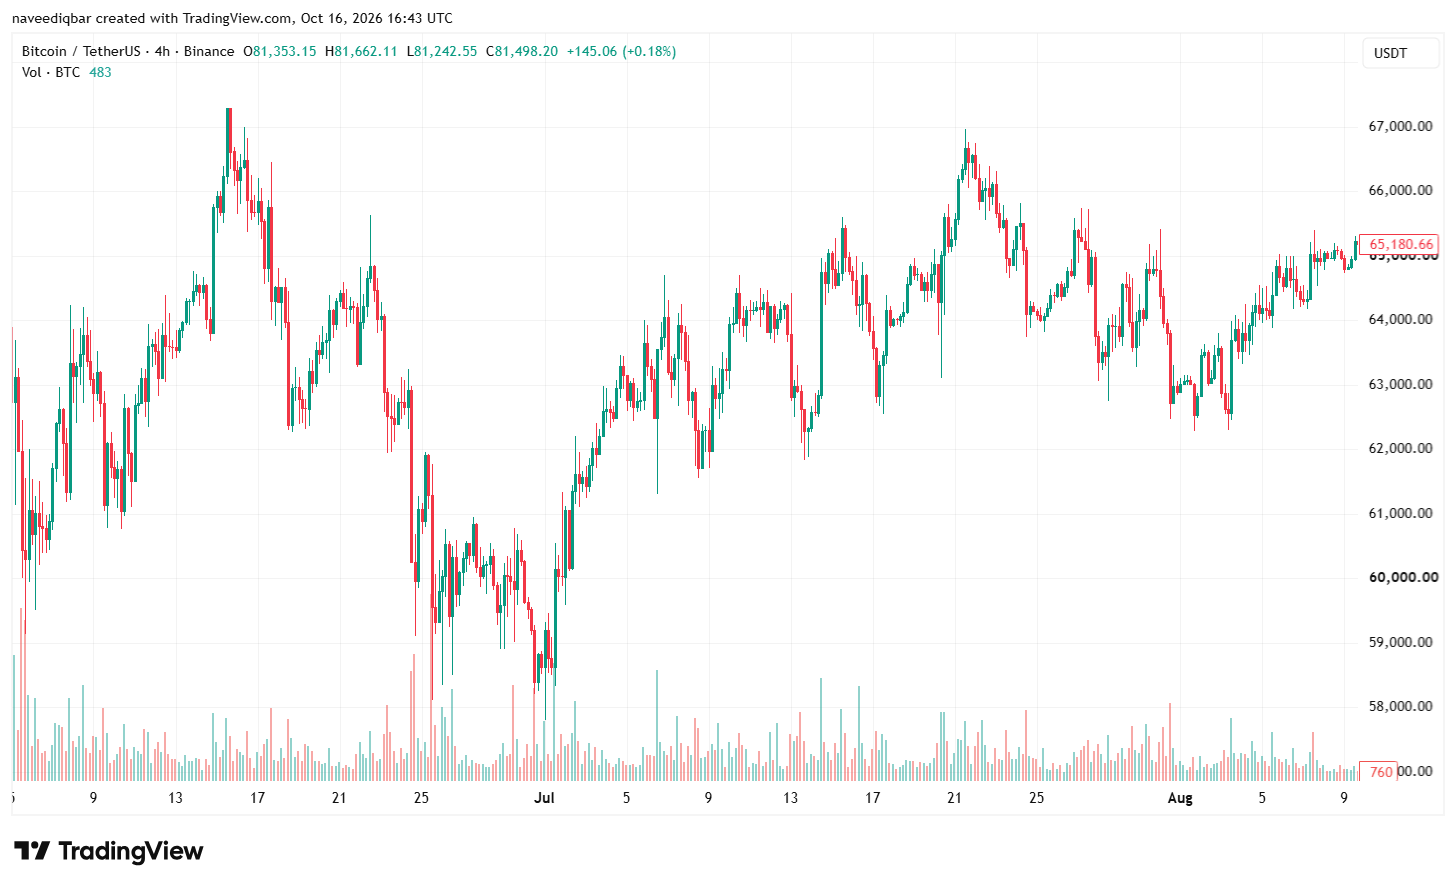
The Binance BTCUSDT four-hour chart shows a different historical price sequence. Its visible candles move through a broad range, with a peak near $67,000 and a decline toward the $60,000s. These values cannot be compared directly with the five-minute BTCUSD readings since the data cover different periods. They also do not establish a simultaneous pricing gap between the platforms.
Forex CFDs and Binance Markets Use Different Price Feeds
A forex broker’s Bitcoin CFD allows traders to speculate on price changes without owning Bitcoin. The quote the broker provides may be from liquidity providers, from external exchanges, or from an aggregated feed. Then the broker shows the prices based on the instrument’s specifications and trading conditions.
Binance, on the other hand, has separate markets. It records all transactions in its spot market, and its futures markets are for contracts that can trade at higher or lower levels than the spot market. Perpetual futures can also respond to funding rates and leveraged positioning. As a result, BTCUSDT spot, BTCUSDT perpetual futures, and a broker’s BTCUSD CFD may produce different candles.
Spreads create another source of variation. The spread is the difference between the bid price and the ask price. Some platforms chart bid prices, while others display last-traded prices or different quote references. During fast market moves, these differences can affect the visible high and low. A broker’s spread may also widen when liquidity falls.
Notably, traders should confirm the exact instrument before comparing charts. The BTCUSDT and ETHUSDT charts identify Binance as the exchange and use four-hour candles. However, the images do not specify whether the instruments represent spot or futures markets. That detail must be checked before concluding price differences.
Follow us on X for real-time crypto updates.
Four-Hour Candles Can Differ Because of Timing
Candlesticks summarize four values: the opening price, highest price, lowest price, and closing price. These values, known as OHLC, depend on the prices recorded during a defined interval. If two platforms use different feeds, they may record different highs and lows within that interval.
Server time can also change the candle’s formation. One platform might close a four-hour candle at 00:00 UTC, while another uses a different schedule. If Bitcoin rallies near the end of one interval, one chart may include the move in its closing candle. Another may place the same movement in the next candle.
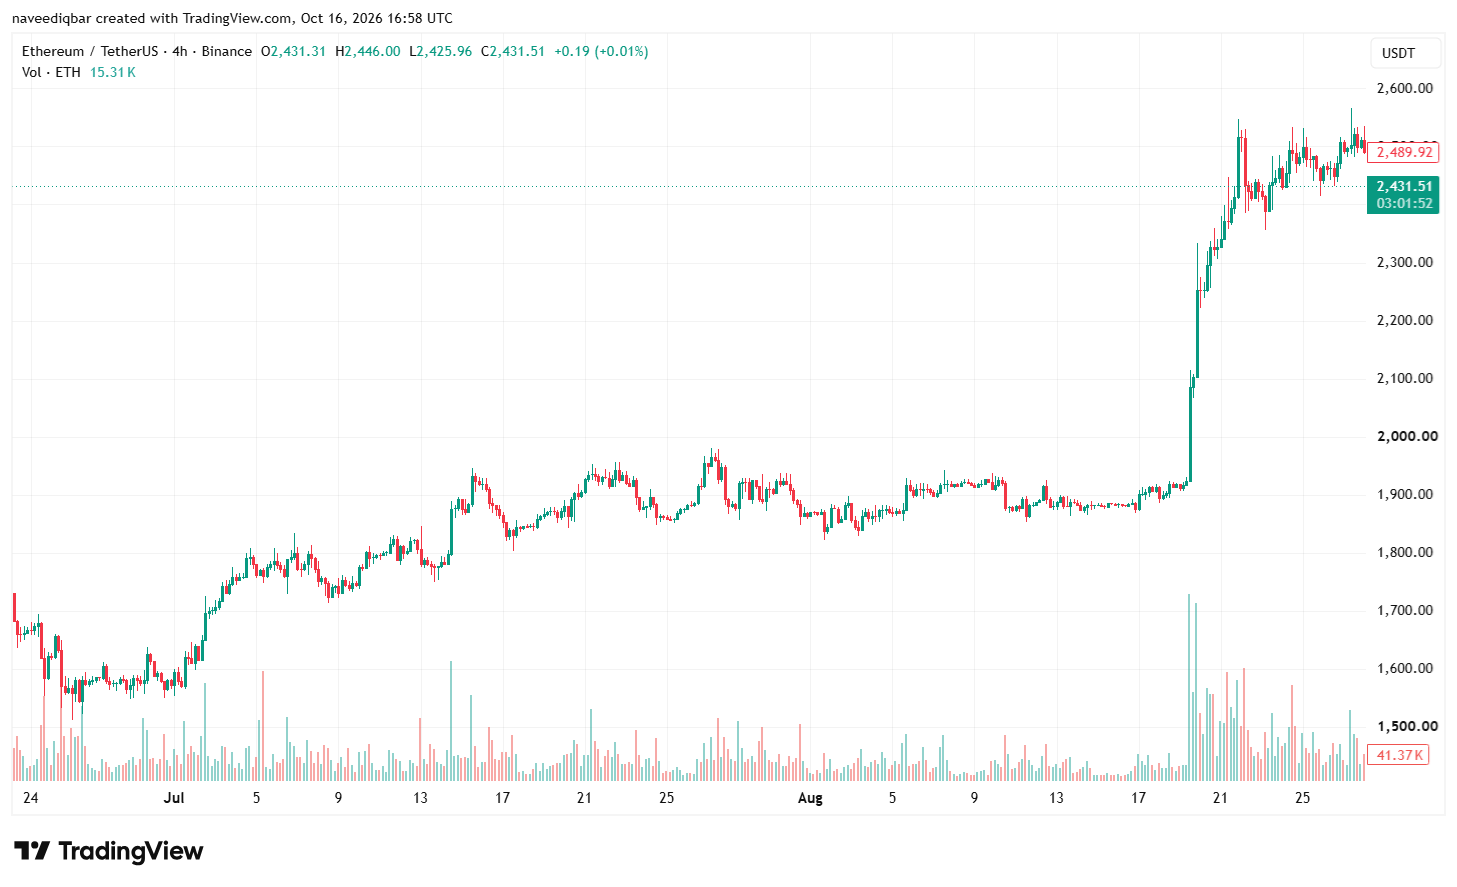
The supplied Binance ETHUSDT chart illustrates a sharp upward move. The visible price action remains largely between approximately $1,850 and $1,950 before a strong rally lifts Ethereum above $2,400. Price then consolidates around $2,4000-$2,500, with the displayed current value near $2,431.51 and a separate red marker at $2,489.92.
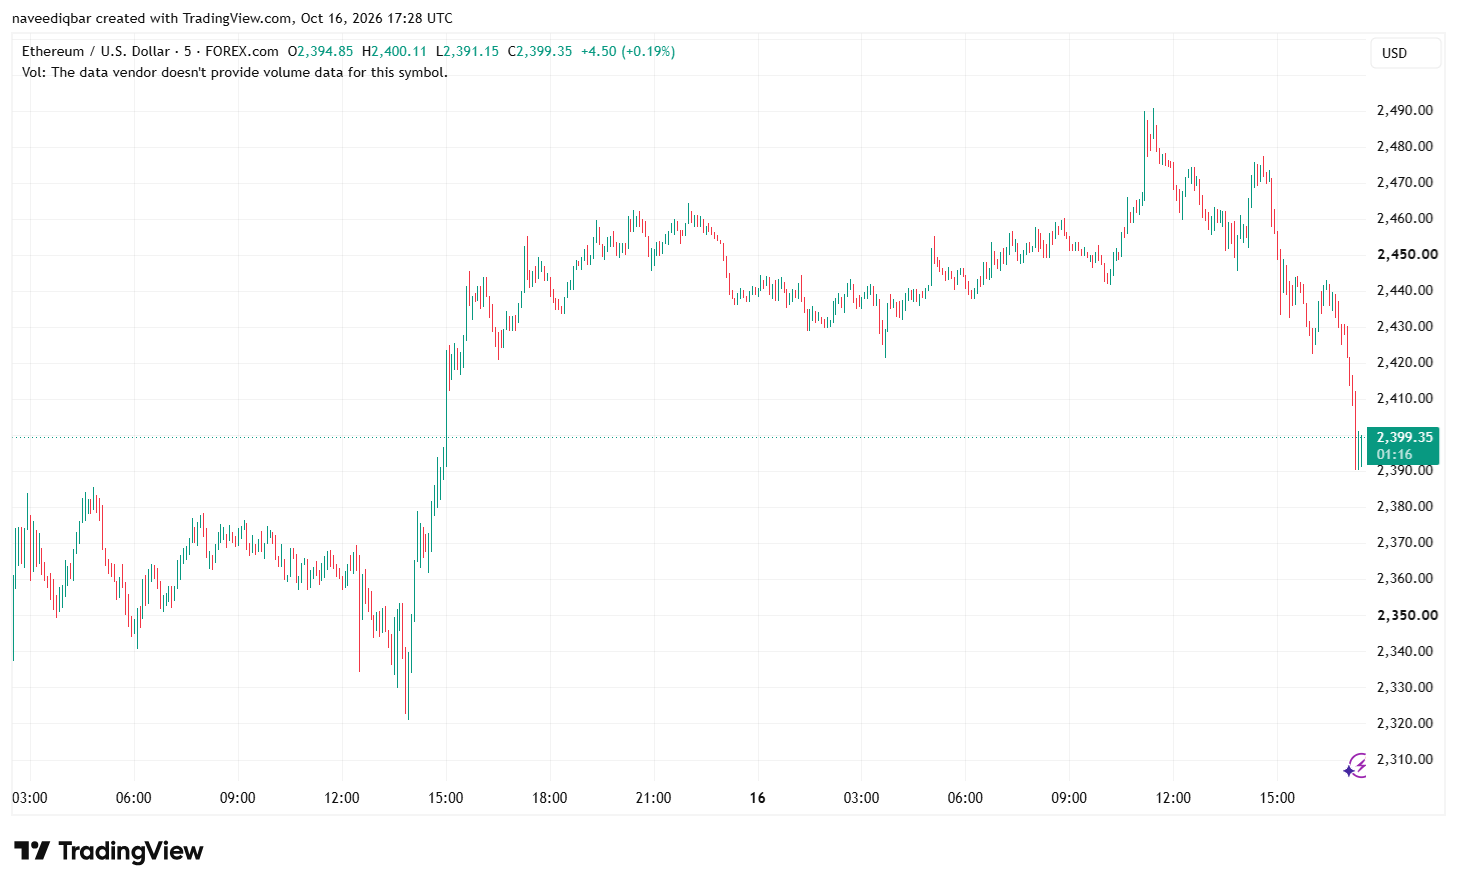
That move creates a different candle structure from the five-minute ETHUSD sequence supplied for the forex chart. The latter records a fall toward $2,320, a recovery toward $2,460, and a subsequent retreat to $2,399.35. These observations refer to the various periods but are in no way a definitive signature of conflicting candles on Binance and the broker. Comparisons must have the same time period and time interval.
Liquidity Sweeps and Weekend Trading Need Careful Checks
A liquidity sweep is when the price breaks out of an established range and then bounces back. Traders tend to pay attention to these levels, as they may be where stop-loss orders are placed. But if the broker’s feed records a higher price spike than the one on Binance, it may not show up on MT5.
For instance, Binance may have a previous resistance level, but the broker’s quote for a CFD contract is lower. The difference may be due to differences in liquidity sources, liquidity spreads, and/or timing. Traders should therefore confirm it is a breakout or sweep on their platform by actually checking the highest and lowest for the move before assuming it is.
Fair-value gaps can also vary since they depend on the relationship between neighboring candles. If the platforms record different OHLC values or divide price activity across different candle boundaries, a gap may appear on one chart but not another. Nevertheless, traders should verify the underlying data before deciding that a technical pattern exists.
Weekend schedules add another complication. Cryptocurrency markets generally trade continuously, including Saturdays and Sundays. Some brokers, however, restrict CFD trading hours or apply specific weekend arrangements. While a broker’s market is closed, Binance may continue recording trades. When the broker reopens, its quote may differ from the latest exchange price.
Which Chart Should Traders Trust?
The correct reference chart is the one that matches the instrument used for execution. A trader buying BTCUSDT spot on Binance should prioritize that market’s chart. Someone trading a BTCUSD CFD through MT5 should use the broker’s feed to confirm entries, exits, and stop-loss levels.
For a practical comparison, traders should open BTCUSD and ETHUSD on their broker and BTCUSDT and ETHUSDT on Binance. They should select the same five-minute and four-hour windows, then compare candle opening times, highs, lows, closes, and spreads. They should also confirm whether each instrument represents a CFD, a spot asset, or a futures contract.
The supplied charts offer examples of different price sequences, but they do not provide a synchronized, same-period comparison across both platforms. Traders cannot use them alone to verify a specific broker-versus-Binance discrepancy. They need matching timestamps and instrument details to complete that test.
Ultimately, traders should base technical decisions on the market where they place their orders. Cross-checking another platform can provide context, but it should not replace the execution chart. Understanding why charts differ can help traders avoid incorrect breakout confirmations, misplaced stop-losses, and misleading technical signals when switching between forex and cryptocurrency platforms.
Subscribe to our YouTube channel for the latest crypto news.
Related: How to Avoid Crypto Scams: Warning Signs Investors Should Know
Disclaimer: The information presented in this article is for informational and educational purposes only. The article does not constitute financial advice or advice of any kind. Coin Edition is not responsible for any losses incurred as a result of the utilization of content, products, or services mentioned. Readers are advised to exercise caution before taking any action related to the company.