


- BLUR market experiences a significant decline due to bearish pressure.
- Moderate volatility in the BLUR market presents short-term trading opportunities.
- Aroon down’s value suggests the strong selling pressure in the BLUR market.
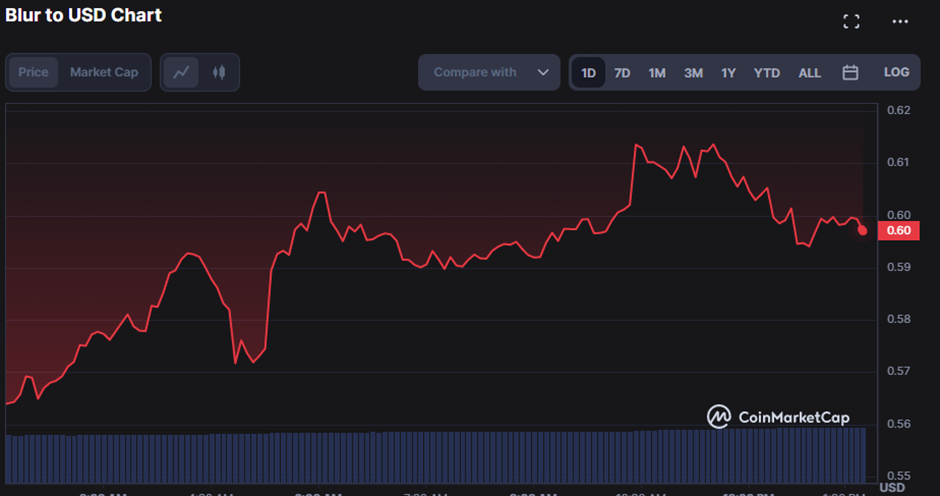
The BLUR market has been controlled by bears over the last 24 hours, with the price dropping from an intraday high of $0.6385 to an intraday low of $0.5574. This price decline may be attributed to profit-takings by investors who had purchased at lower prices and the general bearish market sentiment.
As of press time, the price had fallen by 4.53% to $0.6008 due to persistent bearish pressure. This represents a sizable decline and signals a significant market correction.
The market capitalization declined by 6.32% to $254,062,589 due to the recession, while the 24-hour trading volume climbed by 18.25% to $90,757,631. This trend implies that, despite the decline, investors are aggressively trading, perhaps signaling a change in investing plans toward short-term profits rather than long-term growth.
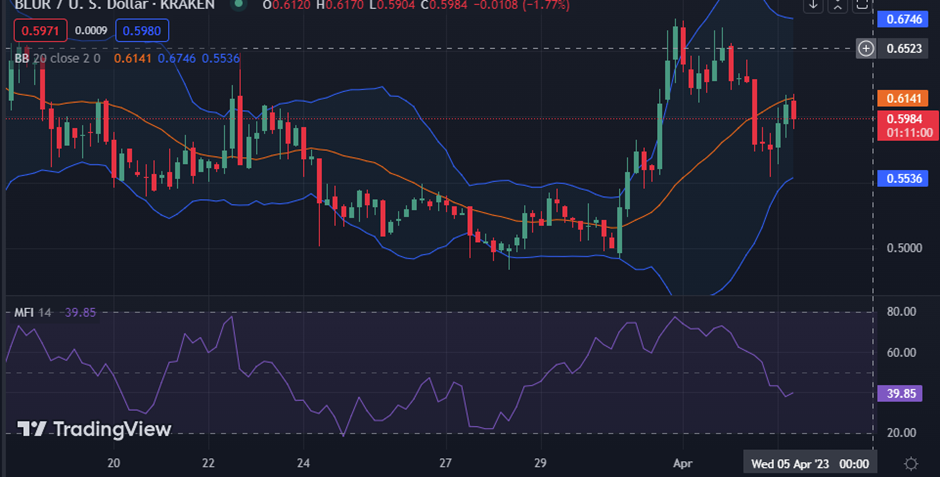
The upper and lower Bollinger Bands (BB) readings are 0.6746 and 0.5534, respectively. These readings indicate moderate volatility in the Blur market, with prices most likely fluctuating within a relatively small range. The average price movement in the Blur market, as indicated by the difference of 0.1212 between the two bands, may present opportunities for short-term traders to profit.
The Money Flow Index (MFI) line on the 4-hour price chart for the Blur market points south and has a value of 40.11. This suggests the market is bearish, and the selling pressure may soon persist. With prices most likely to rise or fall within a relatively narrow range, this indicates moderate volatility in the Blur market.
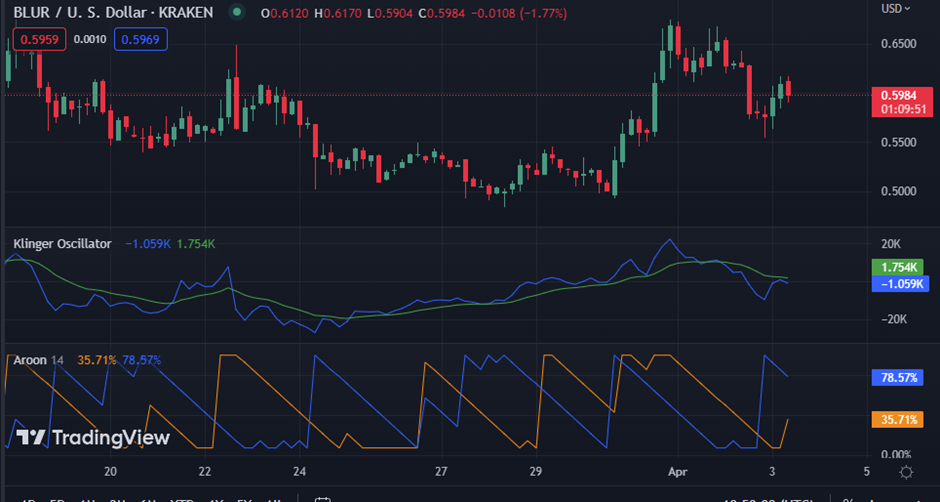
The Klinger Oscillator on the Blur market’s 4-hour price chart is now at -878.7, while the signal line is at 1.78k. As the Klinger Oscillator for the Blur market is below the signal line and in negative territory, this suggests that selling pressure is developing.
The Aroon up and down readings are 35.71% and 78.57%, respectively, indicating that the Blur market is in a significant downturn. This crossover suggests a greater likelihood of the market continuing to move downhill soon since the Aroon down value reflects the strength of the downtrend and the Aroon up value shows the power of the uptrend. The fact that the Aroon down value is substantially greater shows that the market has more selling pressure than buying pressure.
Blur market faces bearish pressure with declining prices and moderate volatility. Short-term profit opportunities may arise for traders amid the downturn.
Disclaimer: The views, opinions, and information shared in this price prediction are published in good faith. Readers must do their research and due diligence. Any action taken by the reader is strictly at their own risk. Coin Edition and its affiliates will not be liable for direct or indirect damage or loss.
Disclaimer: The information presented in this article is for informational and educational purposes only. The article does not constitute financial advice or advice of any kind. Coin Edition is not responsible for any losses incurred as a result of the utilization of content, products, or services mentioned. Readers are advised to exercise caution before taking any action related to the company.


