


- BLUR surges to 7-day high, boosted by investor confidence.
- Support at $0.2012 reverses BLUR’s bearish trend.
- Overbought signals hint at possible BLUR correction.
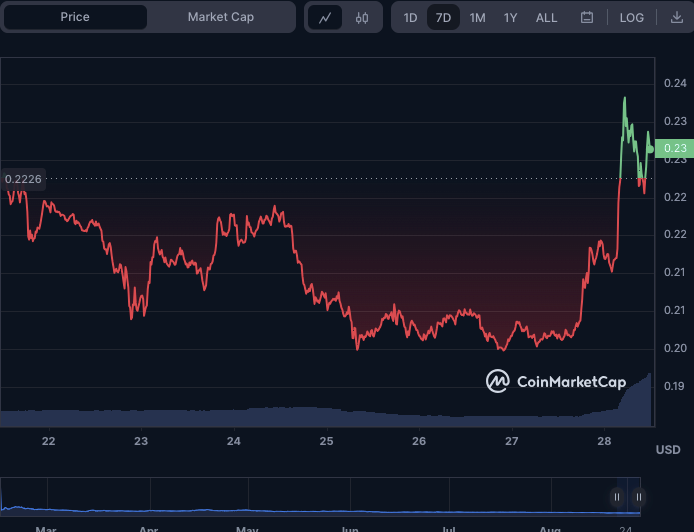
Despite early negative momentum, Blur (BLUR) bulls rallied from a 24-hour low of $0.2012 to a 7-day high of $0.2351, fueled by upbeat market sentiment and intense buying pressure. The upward trend implies investors have recovered faith in Blur and are confident about its potential.
A bullish breach over the $0.2351 resistance level may open the door for additional higher action, with the 30-day high of $0.3149 being the next target. However, a negative reversal might occur if Blur fails to maintain its present trend and falls below the $0.2012 support level.
Blur’s market capitalization and 24-hour trading volume increased by 10.58% and 353.54%, respectively, to $194,728,495 and $76,891,280. Since trading volume increases with trader interest and involvement, price volatility may rise, boosting investor confidence and liquidity in the Blur market.
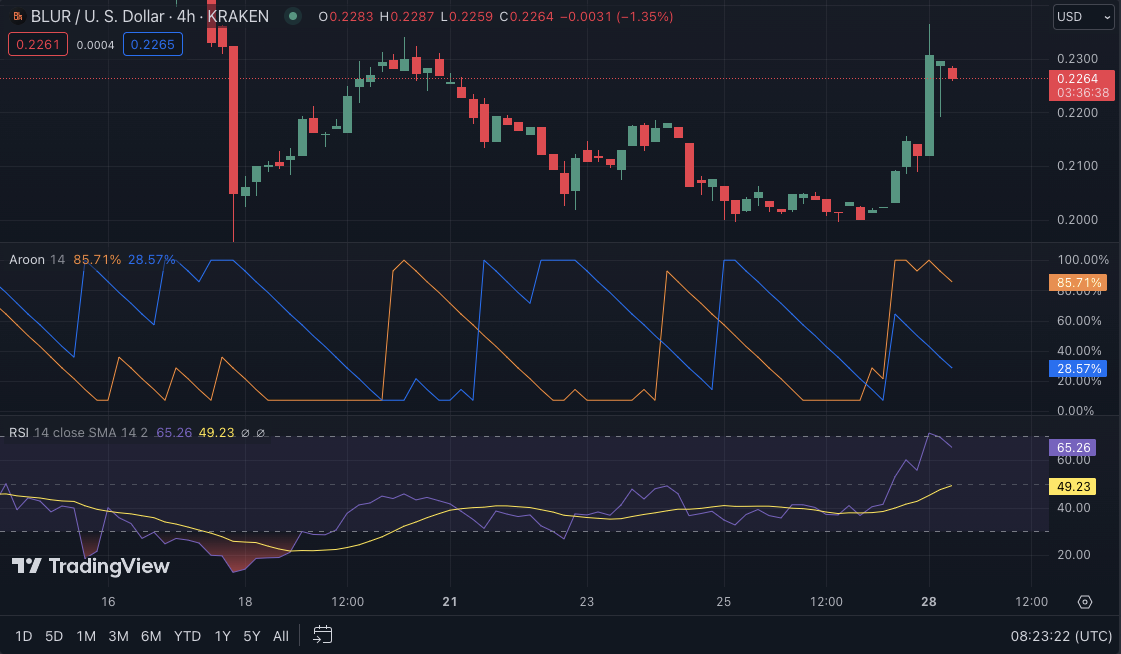
The Aroon up reading of 85.71% and the Aroon down reading of 28.57% indicates a strong bullish trend in Blur’s price movement. This pattern implies that purchasing pressure is high and the market is increasing. As a result, traders may see this as a signal to acquire long positions or keep current holdings in anticipation of a potential rise in Blur.
However, the Relative Strength Index (RSI) is at 68.4 and trending downward, indicating that the price of Blur is approaching overbought territory. If this RSI pattern continues, the bull’s power may falter before it resumes its upward path. Consequently, traders should be cautious and consider taking profits or risk management measures to shield themselves from adverse risks.
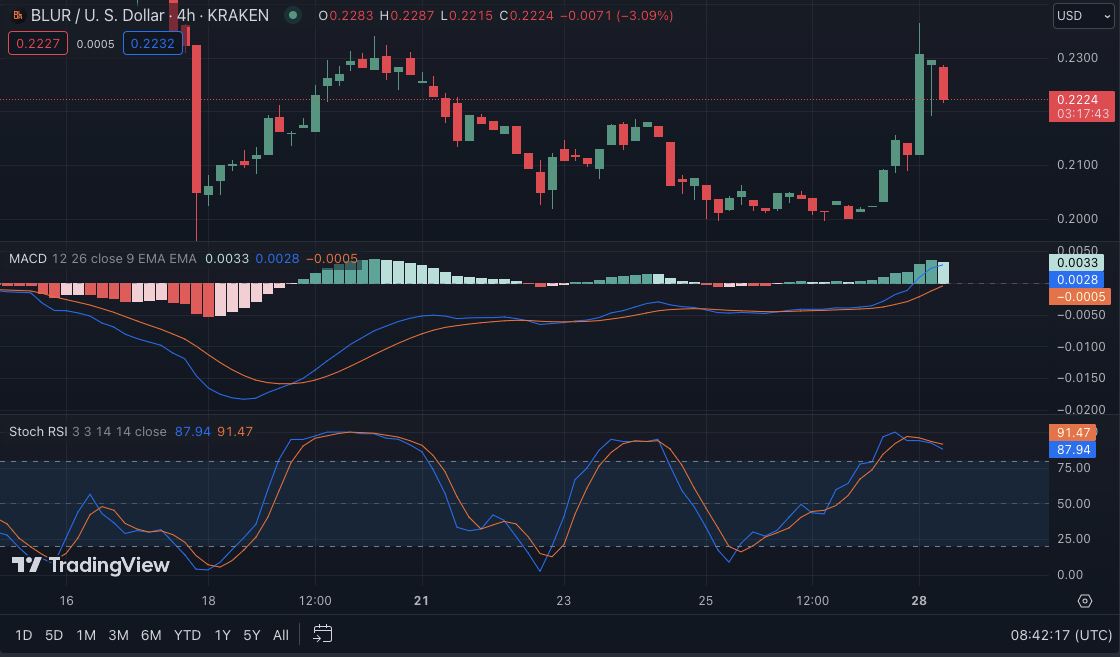
With a score of 0.0033, the Moving Average Convergence Divergence (MACD) trend in the positive area illustrates the intensity of the upward momentum in Blur’s price. This trajectory indicates that buyers remain in charge and that the trend will likely continue. However, the histogram shows a minor drop, suggesting the rising momentum may wane.
Furthermore, the stochastic RSI is now in the overbought zone at 87.94, suggesting a possible slowdown. This level indicates that Blur’s price may be ready for a correction or period of consolidation, as buyers have pushed the price up to unsustainable levels. Moreover, the RSI indicator displays a divergence, with lower highs forming as the price advances.
In conclusion, Blur’s bullish surge reflects renewed investor confidence, but caution is advised as indicators signal potential corrections ahead.
Disclaimer: The views, opinions, and information shared in this price prediction are published in good faith. Readers must do their research and due diligence. Any action taken by the reader is strictly at their own risk. Coin Edition and its affiliates will not be liable for direct or indirect damage or loss.
Disclaimer: The information presented in this article is for informational and educational purposes only. The article does not constitute financial advice or advice of any kind. Coin Edition is not responsible for any losses incurred as a result of the utilization of content, products, or services mentioned. Readers are advised to exercise caution before taking any action related to the company.

 Price Prediction 2026, 2027, 2028, 2029, 2030 -2050")


