


- The Binance coin surges past the $320 mark as a bullish trend drives the price higher.
- BNB/USD pair is currently standing at $320.76, having gained 2.68% over the past 24 hours.
- The next target for the cryptocurrency is at the $322.12 resistance level.
The latest Binance price analysis shows a positive trend for the BNB/USD pair. The coin has been trading in positive sentiment for the last few hours after recovering from the bearish pressure that was in control earlier today. The bullish pressure on the coin has been strong, and it even managed to break above the psychological $ 320.00 level.
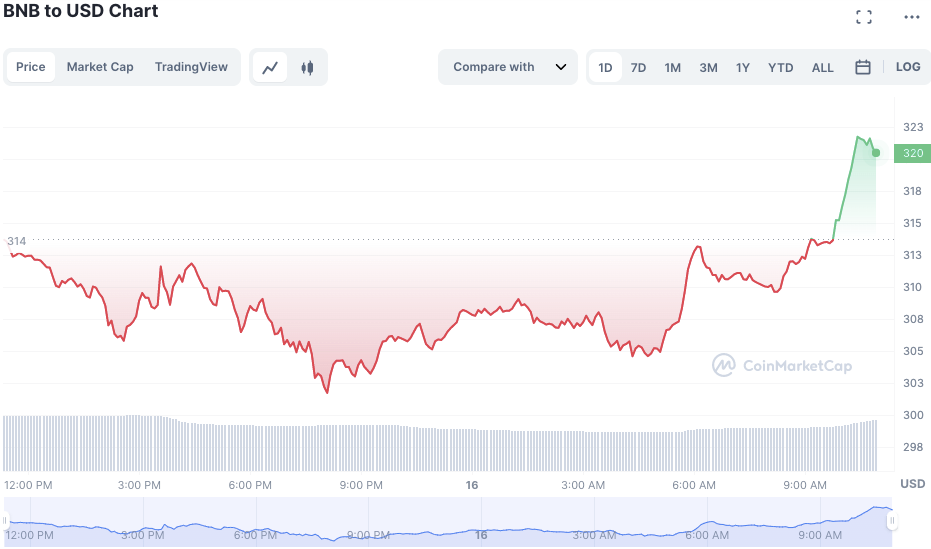
The current price of BNB Coin is at the $320.76 level, with strong bullish momentum in play. The coin has moved up 2.68% over the last 24 hours, and buying activity is likely to increase further in the coming days. The next target for the BNB/USD pair would be at the $322.12 resistance level, which is expected to be a strong hurdle for bulls. If breached successfully, we could expect further gains in the coming days.
On the other hand, the coin is likely to face support at $301, which was a current trading level earlier. If this support does not hold up, the coin could pull back to the $299 level. Today’s market opened trading at a low of $307, and the surge in bullish momentum has taken the coin closer to its resistance level.
Looking at the coin 360-day chart, it can be seen that the BNB/USD pair has followed a bullish trend for the past few hours, with only minor pullbacks along the way. However, other cryptocurrencies in the market have seen losses, which could be attributed to lower investor sentiment and low liquidity, with BTC and ETH seeing losses of -1.8% and -2.84%, respectively.
The circulating supply of BNB Coin is at 157,891,903, indicating the coin’s demand continues to rise. The 24 trading volume for the coin is valued at $739,045,342, and it is down by -12%, indicating a cooling off of investor sentiment. The market cap is on gain as more buyers are entering the market. Currently, it is standing at $50,770,267,660, with an increase of 2.93 percent.
The four-hour technical indicators display a bullish outlook for BNB/USD pair. The Relative Strength Index (RSI) appears to be moving in neutral territory as buyers become more active, and this could cause the RSI to reach the overbought zone. The moving averages have also moved up to $312.0, just below the current market price.
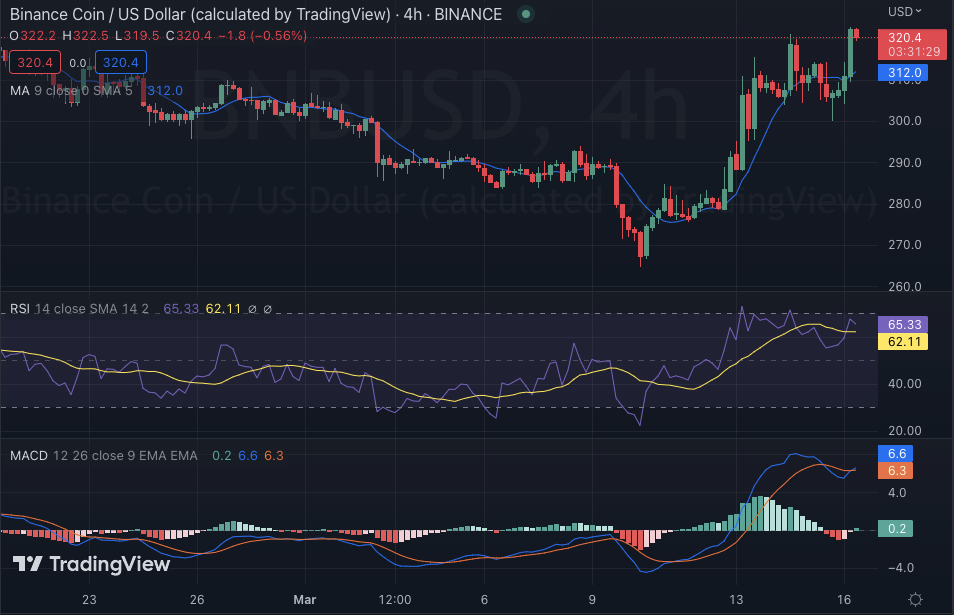
The Moving Average Convergence Divergence (MACD) is on the rise, reflecting the bullish momentum. The MACD line is currently above the signal line, indicating that the buyers are in control of the market. Additionally, The histogram is also in the green zone, revealing that the bulls are getting stronger.
Overall, BNB Coin has seen a strong surge in price over the past few hours, and it appears that this momentum is likely to continue in the near term. The coin is currently trading near its resistance level, but if it breaks through this level, we could see further gains soon. The technical indicators are all pointing toward the bulls, so investors should watch out for further price action.
Disclaimer: The views and opinions, as well as all the information shared in this price analysis, are published in good faith. Readers must do their own research and due diligence. Any action taken by the reader is strictly at their own risk, Coin Edition and its affiliates will not be held liable for any direct or indirect damage or loss.
Disclaimer: The information presented in this article is for informational and educational purposes only. The article does not constitute financial advice or advice of any kind. Coin Edition is not responsible for any losses incurred as a result of the utilization of content, products, or services mentioned. Readers are advised to exercise caution before taking any action related to the company.


