



- BNB dropped 10.51% after Binance’s $6.3 billion breach and rebounded toward $701.
- Daily chart shows $674.60 support below the 200-day EMA at $692.43 after the breakdown.
- Weekly chart puts Fibonacci support at $698.95, with resistance starting at $772.56.
Binance Coin dropped 10.51% toward $680 following Binance’s October 29 security breach, then recovered near $701 on Friday. BNB nevertheless remained 7.77% below its pre-selloff level, placing September support back in focus.
The price analysis identifies $674.60 as the decisive lower boundary after a breakdown on the daily chart. Binance estimated $6.3 billion in affected assets and identified a potentially compromised engineer’s laptop during its preliminary investigation.
However, Binance reported no evidence that wallet private keys were leaked. Binance subsequently reserved more than $6.34 billion to cover losses, including $5 billion held in affected tokens, while approximately $3 billion in affected assets were frozen.
| Metric | Reported Value |
| Price Decline | 10.51% |
| Friday Recovery | Approximately $701 |
| Pre-Selloff Difference | −7.77% |
| Binance Hack | $6.3 Billion |
| Recovery Reserves | Over $6.34 Billion |
| Frozen Assets | Approximately $3 Billion |
BNB Price Analysis Shows 10.5% Crash Toward September Lows
The Binance Coin price analysis shows the token losing ascending trendline support after failing to clear $750.47–$762.20. Selling pressure then pushed BNB toward the September low area spanning $683 to $674.60.
Despite Binance’s recovery reserves, BNB remained below the broken trendline support, leaving Friday’s rebound short of an established reversal. Moreover, Binance Coin reclaimed its 200-day exponential moving average at $692.43, although the break below rising support remained intact.
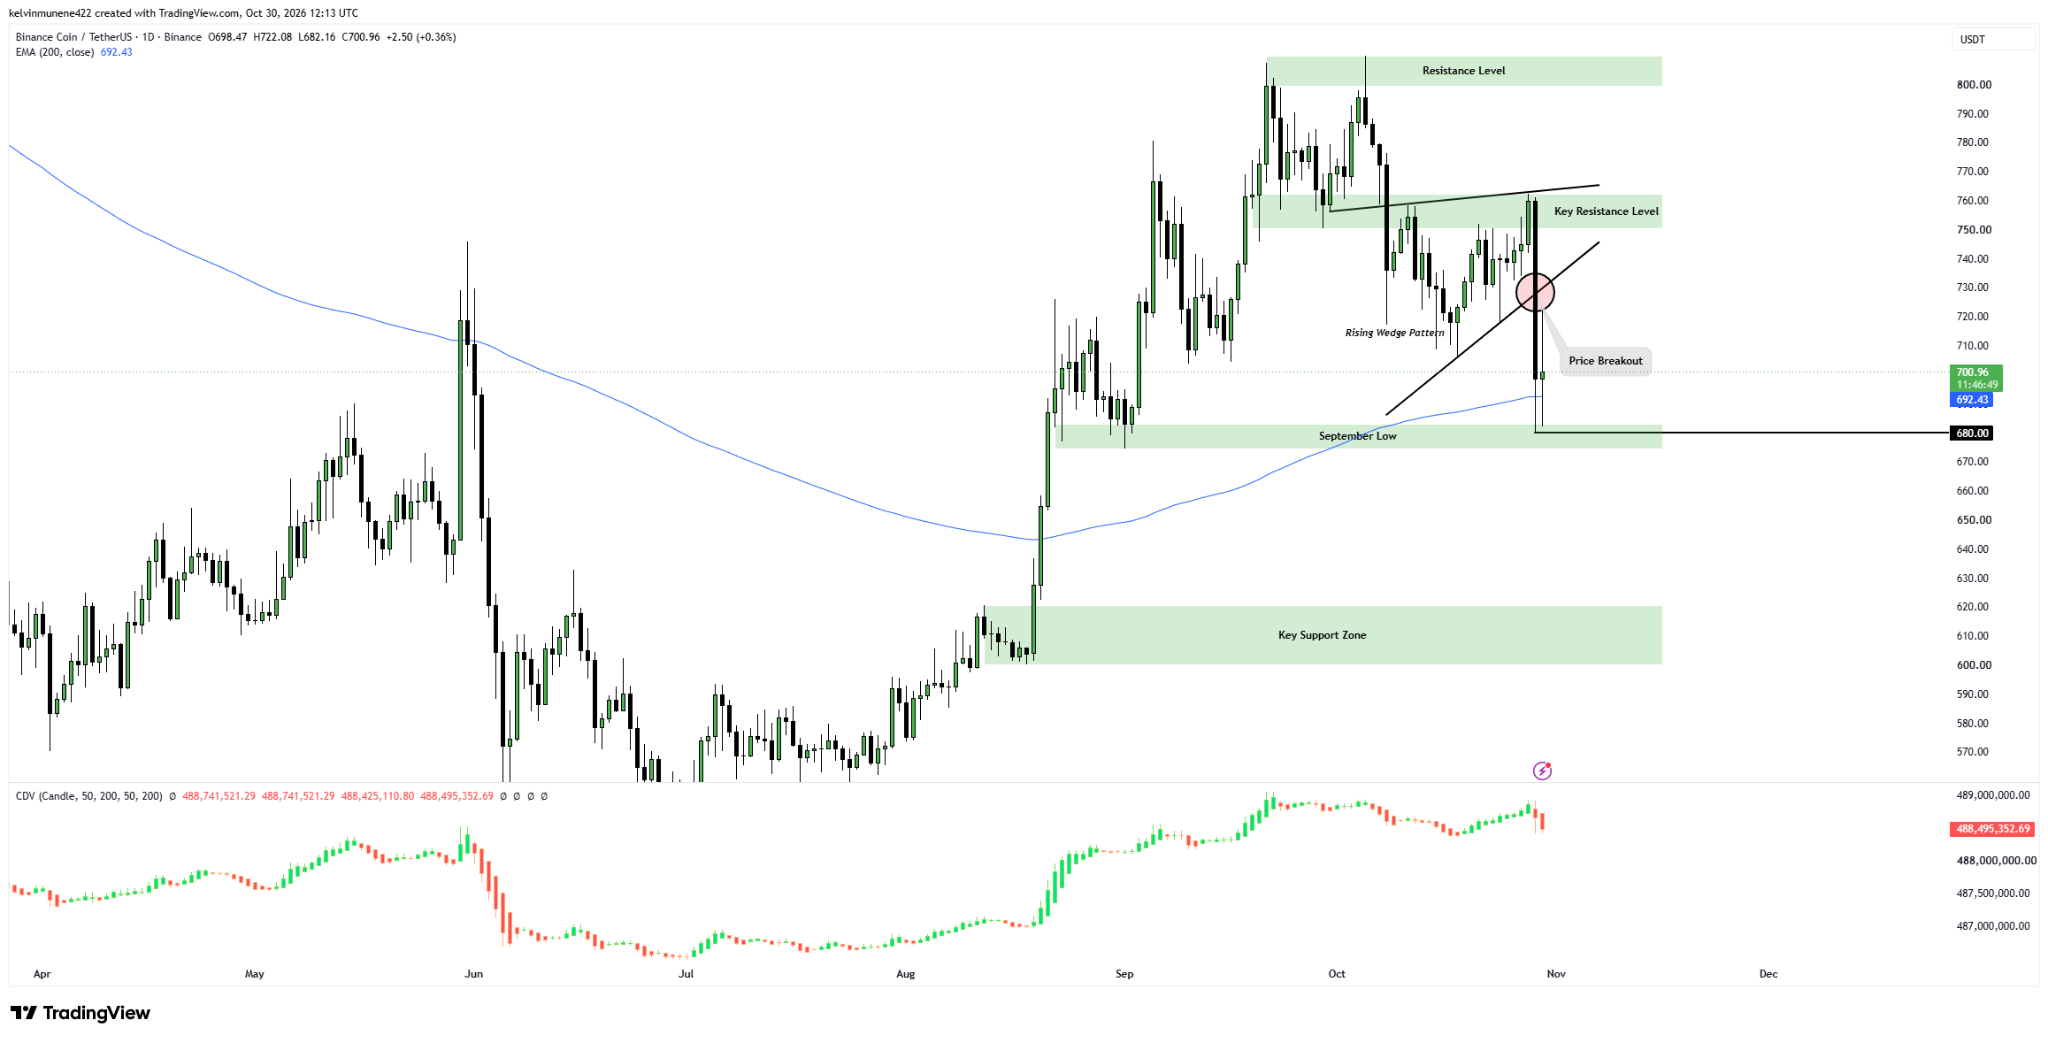
As of press time, BNB’s price analysis places $674.60 below this average as the next critical threshold. A sustained close beneath that level would expose the $620.55–$600 zone. For Binance Coin, the price analysis also identifies $750.47–$762.20 as the first major overhead barrier. A recovery beyond that band would bring $799.41–$809.99 into view.
Follow us on X for real-time crypto updates.
BNB Weekly Chart Maps $698.95 Support and $772.56 Resistance
On the weekly chart, Binance Coin remains within a $674.60–$702.37 support band. The BNB price analysis highlights the 38.2% Fibonacci retracement at $698.95, close to Friday’s quoted value. This overlap places the token near two independently identified support references.
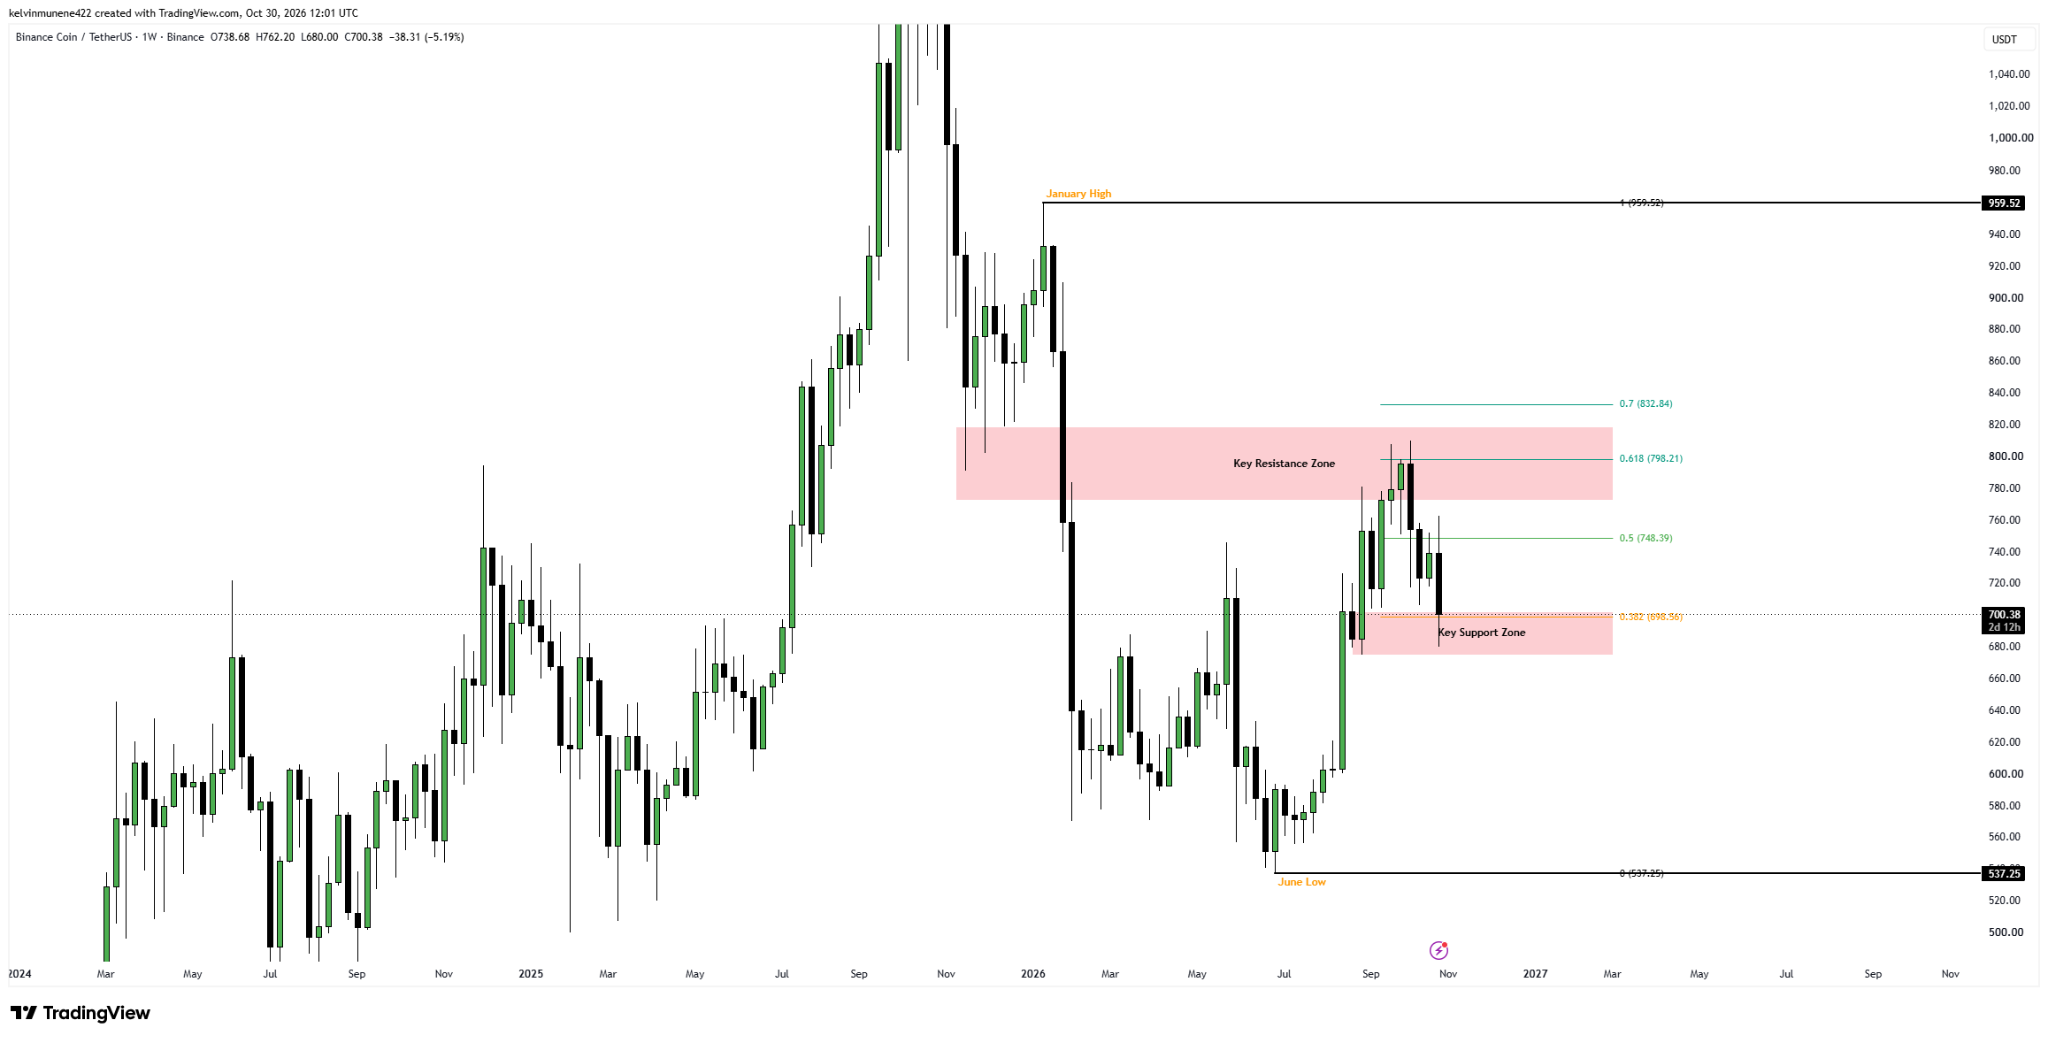
On the upside, the Binance Coin price analysis marks $748.39 at the 50% retracement, followed by $798.21 at 61.8%. BNB also faces weekly resistance extending from $772.56 to $813.39. Therefore, a weekly close below $674.60 would weaken support, while reclaiming $772.56 would mark a stronger rebound.
As Binance continues security checks and asset recovery efforts, BNB remains near its lower weekly boundary. Consequently, market participants are monitoring whether buyers can defend this support and establish a stronger recovery.
Key BNB Technical Levels
| Price Level | Technical Significance |
| $799.41–$809.99 | Higher Resistance |
| $772.56 | Weekly Recovery Threshold |
| $748.39 | 50% Fibonacci Retracement |
| $698.95 | 38.2% Fibonacci Support |
| $692.43 | 200-Day EMA |
| $674.60 | Critical Support |
| $620.55–$600 | Lower Support Zone |
Bullish Case
Holding $674.60 and reclaiming $748.39 would strengthen recovery prospects, placing $772.56 and $798.21 in focus.
Bearish Case
A sustained close below $674.60 would weaken September support and expose the $620.55–$600 zone.
FAQs
The decline followed Binance’s October 29 security breach involving approximately $6.3 billion in assets.
The September low at $674.60–$683 represents the critical downside threshold.
A sustained breakdown would expose the $620.55–$600 support zone.
The weekly chart identifies $748.39, $772.56, and $798.21 as recovery thresholds.
Subscribe to our YouTube channel for the latest crypto news.
Disclaimer: The information presented in this article is for informational and educational purposes only. The article does not constitute financial advice or advice of any kind. Coin Edition is not responsible for any losses incurred as a result of the utilization of content, products, or services mentioned. Readers are advised to exercise caution before taking any action related to the company.