


- Bears currently control the BNB market, but bulls may stage a comeback.
- Short-term correction in the BNB market presents buying opportunities.
- Crossing of long-term and short-term moving averages signals possible buying opportunities.
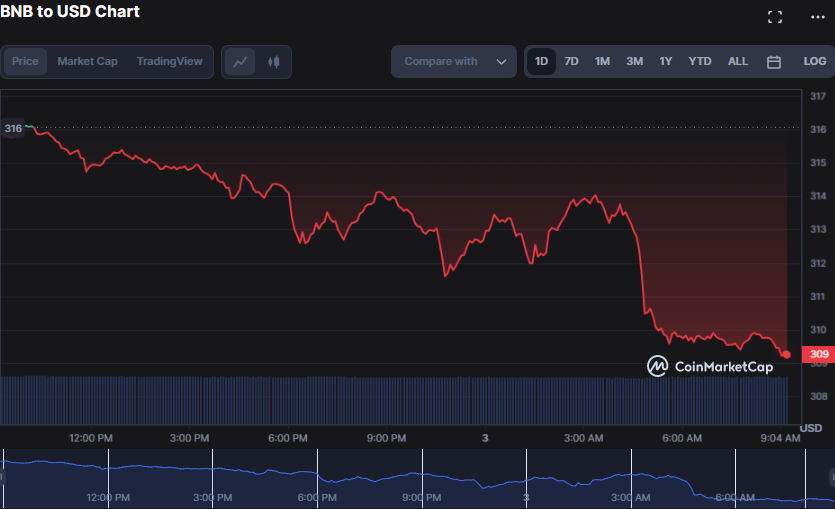
Bears took control of the BNB market early in the trading day, sending prices down from an intraday high of $316.16 (where resistance was hit) to a low of $309.22. The current price of $309.23, a drop of 2.18%, indicates that the bears are in control of the market; however, whether or not the bulls will stage a return and drive the price back up remains to be seen.
If BNB drops below $309.22, the next support levels to watch are $305.50 and $301.80. If buyers can push the price over $316.16, then $320.50 and $325.80 would be the following significant resistance levels.
During the downturn, the 24-hour trading volume and market capitalization decreased by 1.55% and 2.17%, respectively, to $447,589,374 and $48,827,034,579. This drop signifies a short-term correction in the BNB market, and investors should carefully observe the price movement to assess whether it is a good moment to buy or sell.
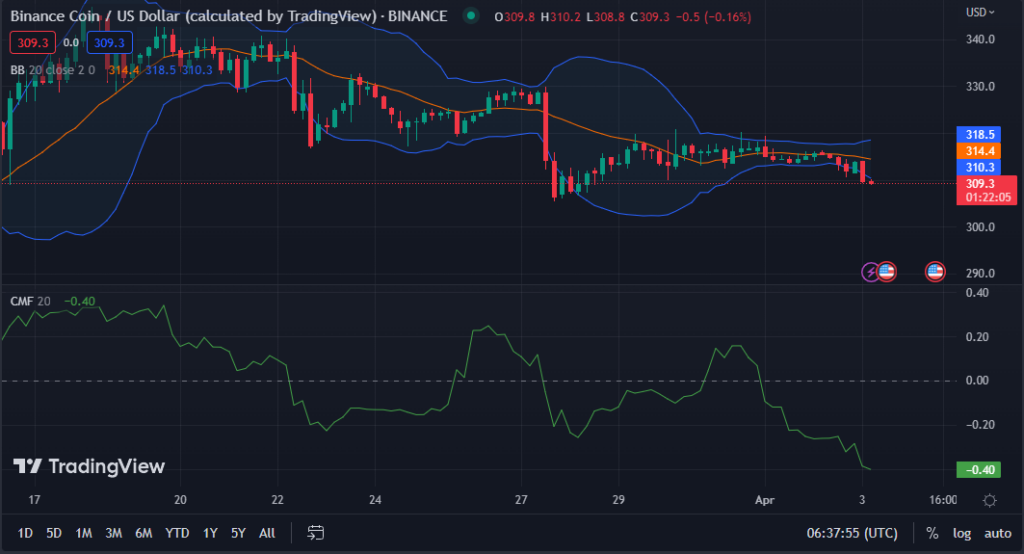
The widening Bollinger bands on the BNB 4-hour chart indicate that selling pressure is increasing, and the price may continue to fall in the near future.
This motion is apparent with the top bar at $318.5 and the bottom bar at $310.3. The price action movement below the lower band indicates oversold circumstances, which may result in a short-term rebound up to the middle band around $314.
Selling pressure is more significant than buying pressure in the BNB market, as shown by the Chaikin Money Flow indicator, trending south and reading -0.40. This pattern indicates that investors are currently averse to BNB and may continue to reduce their holdings, which might lead to more price declines in the near future.
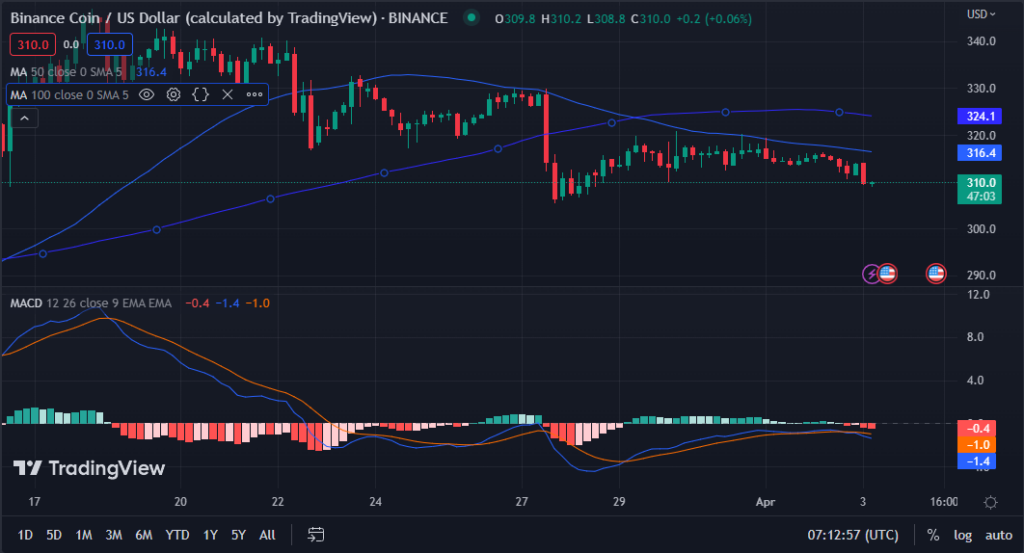
The crossing of the long-term moving average above the short-term moving average indicates that the BNB’s bearish trend is reversing, signaling a possible buying opportunity for traders.
This movement indicates that traders who purchase BNB now may benefit from a possible price gain in the near future as the trend swings in a favorable direction. The 100-day moving average is $324.1, while the 50-day moving average is $316.4.
With the price action moving below 100 and 50-day MA’s, the downward trend may have bottomed, and the bulls are gaining ground.
Since the MACD blue line is sliding below its signal line and into negative territory, with a reading of -1.4, the BNB recovery may find some resistance. However, the overall view is good, and investors may consider adding BNB to their portfolios for possible gains in the coming weeks.
In conclusion, BNB’s short-term correction presents a buying opportunity, but caution is advised as bears still dominate the market.
Disclaimer: The views, opinions, and information shared in this price prediction are published in good faith. Readers must do their research and due diligence. Any action taken by the reader is strictly at their own risk. Coin Edition and its affiliates will not be liable for direct or indirect damage or loss.
Disclaimer: The information presented in this article is for informational and educational purposes only. The article does not constitute financial advice or advice of any kind. Coin Edition is not responsible for any losses incurred as a result of the utilization of content, products, or services mentioned. Readers are advised to exercise caution before taking any action related to the company.


 Price Prediction 2026, 2027, 2028, 2029, 2030-2050")

