


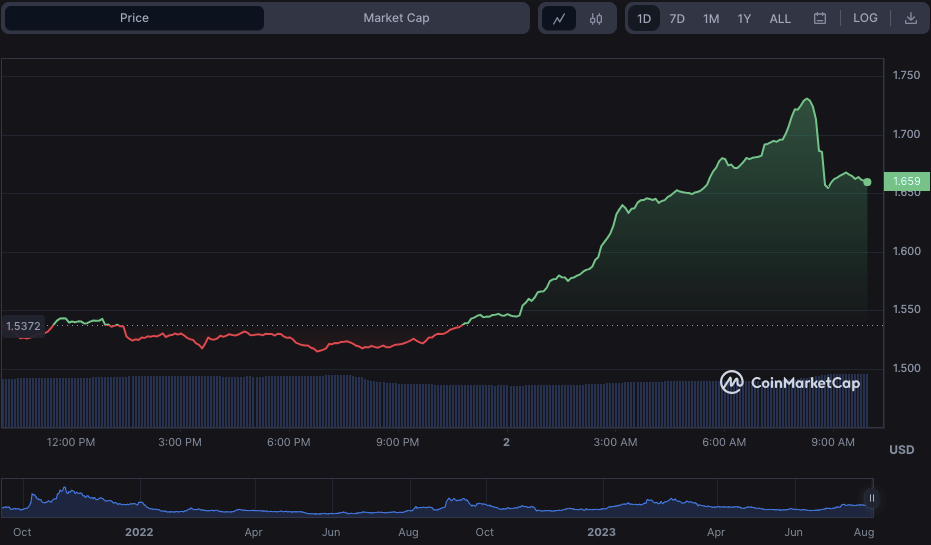
- BONE’s strong support at $1.51 sparks bullish momentum to record a 90-day high.
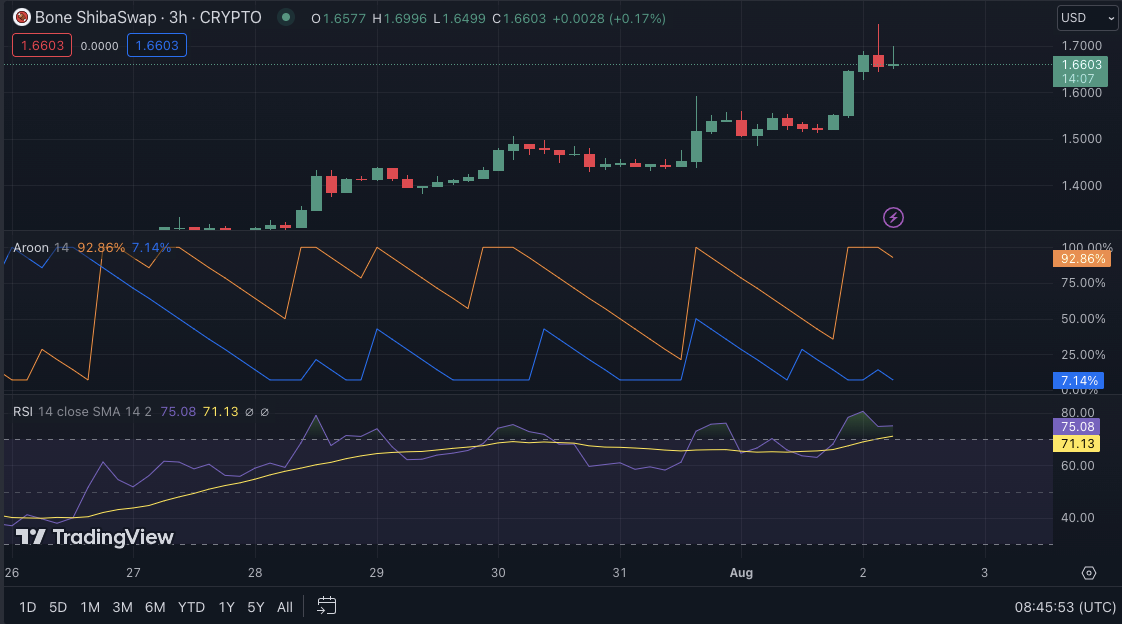
- Bullish Aroon and MACD indicators point to potential gains if bulls’ power does not fade.
- High RSI and shifting stochastic RSI warns of overbought market, brace for correction.
After consolidation in the Bone ShibaSwap (BONE) market, support was established at $1.51. This level had previously served as a strong resistance zone but now appears to be a solid support zone.
As a result, bulls swept away the bears’ reign and began pushing BONE prices higher. The increased buying pressure resulted in a significant uptrend, with the price reaching a 90-day high of $1.73 before coming up against resistance.
If the bulls break through the resistance, the next critical level to watch for is $1.80, potentially opening the door to further gains. However, if the resistance holds, traders may experience a temporary consolidation or a minor pullback as they take profits at these levels.
BONE was priced at $1.66 at press time, a 7.92% increase from its previous close, reflecting the market’s positive momentum. Furthermore, Bone’s market capitalization and 24-hour trading volume increased by 7.91% and 11.19%, respectively, to $381,432,884 and $16,043,726.
Aroon up at 92.86 and Aroon down at 7.14% indicate a robust and potentially lasting bullish trend. This trajectory suggests that the current uptrend dominates the market, with little downside pressure. On the other hand, the downward pointing of the Aroon up and the increasing Aroon down reading may indicate a possible shift in market sentiment.
The bullish momentum is bolstered further by the Relative Strength Index (RSI) reading of 77.81. However, this high RSI reading indicates that the market is overbought and a price correction is imminent. This level may result in a temporary price decrease as investors take profits and the market adjusts.
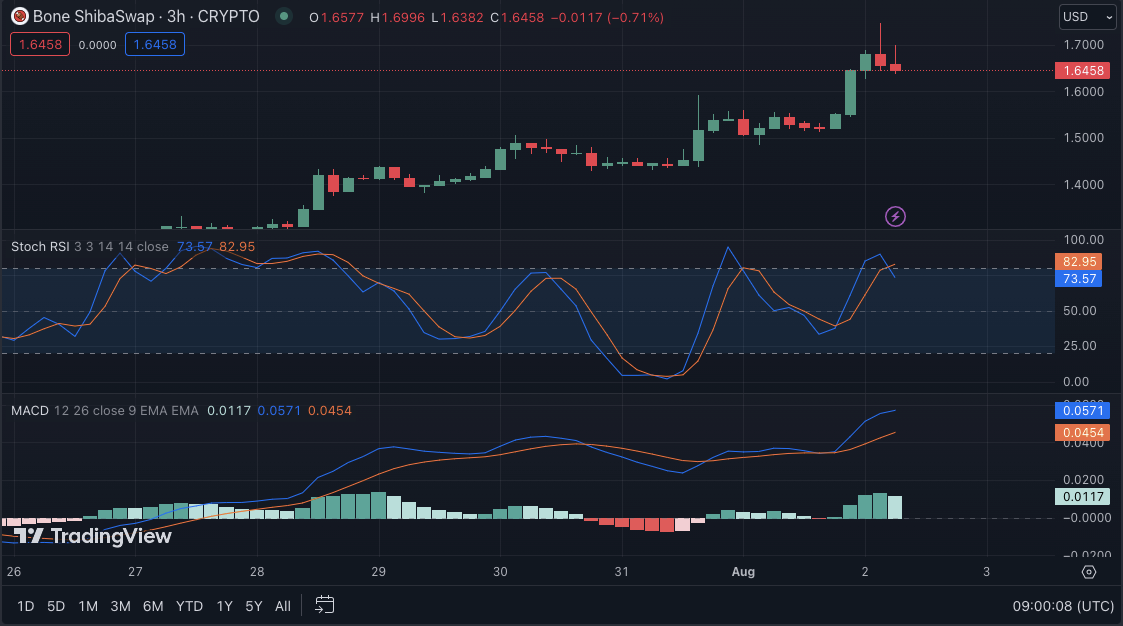
At a score of 0.0572, the Moving Average Convergence Divergence (MACD) motion is in the positive zone, indicating that the bullish trend is still in place. Green histograms and a rising MACD line confirm the strength of the bullish momentum. But, traders should exercise caution because the high RSI reading signals a possible market correction soon.
On the other hand, the stochastic RSI has moved below its signal line, with a reading of 74.40, indicating that the market may be overbought and due for a short-term downturn. This could result in a temporary break in the bullish trend, allowing for a healthy consolidation before it resumes its upward journey.
To sum up, BONE’s bullish trend shows promise, with strong support at $1.51 and potential for further gains if resistance is broken. However, caution is advised as an imminent correction may occur.
Disclaimer: The views, opinions, and information shared in this price prediction are published in good faith. Readers must do their research and due diligence. Any action taken by the reader is strictly at their own risk. Coin Edition and its affiliates will not be liable for direct or indirect damage or loss.
Disclaimer: The information presented in this article is for informational and educational purposes only. The article does not constitute financial advice or advice of any kind. Coin Edition is not responsible for any losses incurred as a result of the utilization of content, products, or services mentioned. Readers are advised to exercise caution before taking any action related to the company.

: What Happens If You Use an Unlicensed Platform?")


