


- Bullish BONE price prediction ranges from $1.5 to $2.
- Analysis suggests that the BONE price might reach $1.14.
- The BONE bearish market price prediction for 2023 is $0.6855.
Bone ShibaSwap (BONE) is one of the flagship tokens for ShibaSwap, a decentralized ecosystem associated with the Shiba Inu community. ShibaSwap is a decentralized exchange (DEX) that allows users to swap tokens and leverage various DeFi opportunities such as staking, providing liquidity, and farming. BONE is a utility-enabled token.
If you are interested in the future of Bone ShibaSwap (BONE) and would like to know the price analysis and price prediction of BONE for 2023, 2024, 2025, 2026, and up to 2030, keep reading this Coin Edition article.
What is Bone ShibaSwap (BONE)?
BONE is a Shibaswap ecosystem governance token that allows the #ShibArmy to vote on new ideas. The more BONE users possess the greater the weight of their vote for the BONE ecosystem. BONE has a total number of 250,000,000 tokens with 229,923,351 BONE in the circulating supply.
BONE is part of the Ethereum-based Shiba ecosystem where Shiba Inu (SHIB) and Doge Killer (LEASH) are all members. As per the Shiba Inu website, SHIB is the “Dogecoin (DOGE) killer.” Due to its popularity and fame, the project is the second-largest dog-inspired meme coin in the crypto space.
Table of contents
- What is Bone ShibaSwap (BONE)?
- Bone ShibaSwap (BONE) Overview
- Analysts’ View on Bone ShibaSwap (BONE)
- Bone ShibaSwap (BONE) Current Market Status
- Bone ShibaSwap (BONE) Price Analysis 2023
- Bone ShibaSwap (BONE) Price Prediction 2023-2030 Overview
- Bone ShibaSwap (BONE) Price Prediction 2023
- Bone ShibaSwap (BONE) Price Prediction 2024
- Bone ShibaSwap (BONE) Price Prediction 2025
- Bone ShibaSwap (BONE) Price Prediction 2026
- Bone ShibaSwap (BONE) Price Prediction 2027
- Bone ShibaSwap (BONE) Price Prediction 2028
- Bone ShibaSwap (BONE) Price Prediction 2029
- Bone ShibaSwap (BONE) Price Prediction 2030
- Bone ShibaSwap (BONE) Price Prediction 2040
- Bone ShibaSwap (BONE) Price Prediction 2050
- Conclusion
- FAQ
- More Crypto Price Predictions:
Bone ShibaSwap (BONE) Overview
| 🪙 Name | Bone ShibaSwap |
| 💱 Symbol | BONE |
| 🏅 Rank | #949 |
| 💲 Price | $0.04499959091626 |
| 📊 Price Change (1h) | -0.03 % |
| 📊 Price Change (24h) | -3.29 % |
| 📊 Price Change (7d) | -0.13 % |
| 💵 Market Cap | $10346456.720125 |
| 💸 Circulating Supply | 229923350.62288 BONE |
| 💰 Total Supply | 249999401.82485 BONE |
Bone ShibaSwap (BONE) is currently trading at $0.04499959091626 and sits at number #949 on CoinMarketCap in terms of market capitalization. There are 229923350.62288 BONE coins currently in circulation, bringing the total market cap to $10346456.720125.
Over the past 24 hours, Bone ShibaSwap has decreased by 3.29%. Looking at the last week, the coin is down by 0.13%.
Analysts’ View on Bone ShibaSwap (BONE)
The SHIB INFORMER informed its users that they could stake SHIB on ShibaSwap and receive BONE for it.
Bone ShibaSwap (BONE) Current Market Status
Bone ShibaSwap has a circulating supply of 229,923,351 BONE coins, while its maximum supply is 250,000,000 BONE, according to CoinMarketCap. At the time of writing, BONE is trading at $1.25 representing 24 hours decrease of 0.57%. The trading volume of BONE in the past 24 hours is $7,722,335 which represents a 14.94% decrease.
Some top cryptocurrency exchanges for trading BONE are OKX, Deepcoin, Bitget, CoinW, and LBank.
Now that you know BONE and its current market status, we shall discuss the price analysis of BONe for 2023.
Bone ShibaSwap (BONE) Price Analysis 2023
Currently, Bone ShibaSwap (BONE) ranks 106 on CoinMarketCap. Will BONE’s most recent improvements, additions, and modifications help its price go up? First, let’s focus on the charts in this article’s BONE price forecast.
Bone ShibaSwap (BONE) Price Analysis – Bollinger Bands
The Bollinger bands are a type of price envelope developed by John Bollinger. It gives a range with an upper and lower limit for the price to fluctuate. The Bollinger bands work on the principle of standard deviation and period (time).
The upper band as shown in the chart is calculated by adding two times the standard deviation to the Simple Moving Average while the lower band is calculated by subtracting two times the standard deviation from the Simple Moving Average. When the bands widen, it shows there’s going to be more volatility and when they contract, there is less volatility.
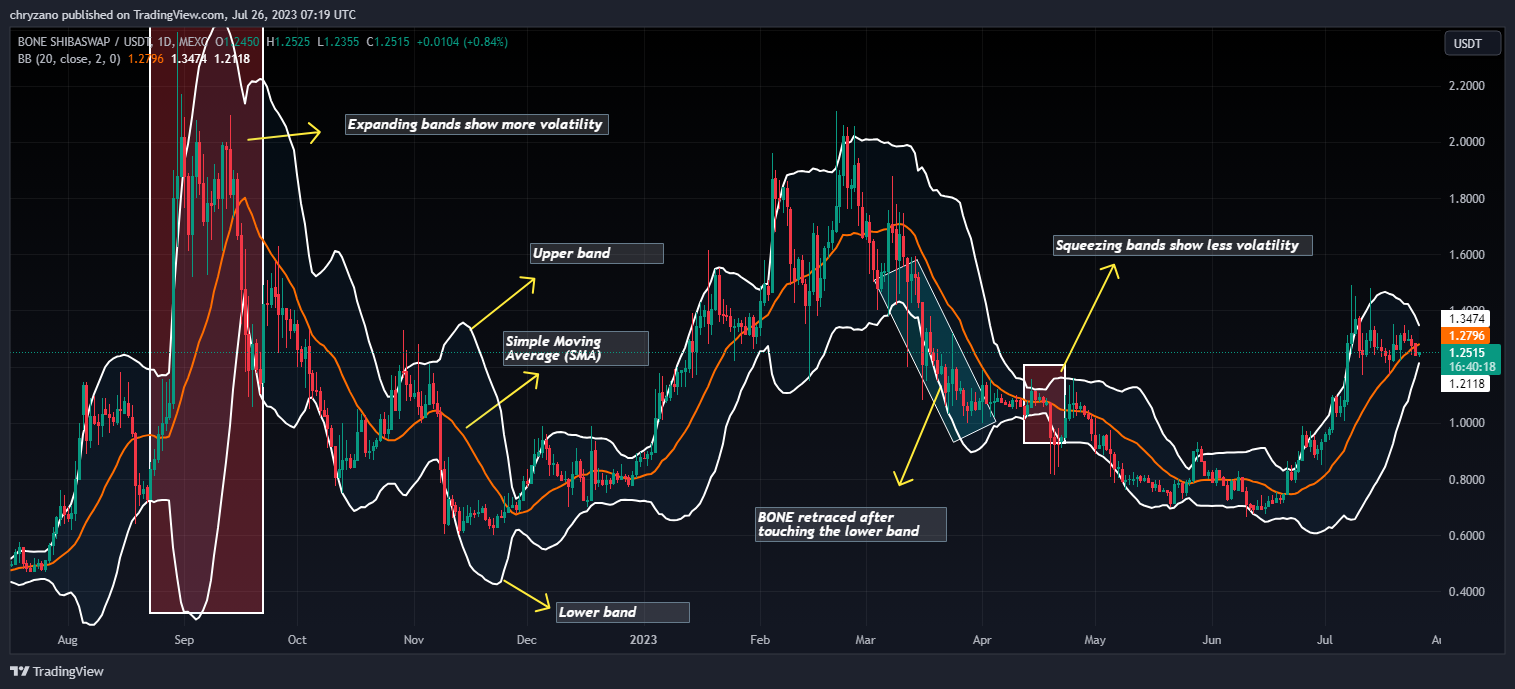
When Bollinger bands are used in a cryptocurrency chart, we could expect the price of the cryptocurrency to reside within the upper and lower bounds of the Bollinger bands 95% of the time. The above thesis is derived from an Empirical law.
The sections highlighted by red rectangles in the chart above show how the bands expand and contract. When the bands widen, we could expect more volatility, and when the bands contract, it denotes less volatility. The green rectangles show how BONE retraced after touching the lower band (oversold).
Currently, the Bollinger bands are squeezing and BONE has crossed below the SMA. As such we could expect BONE to reach the lower band and bounce off of it. Moreover, the Bollinger band width indicator is also tilting downwards. Hence, there might be less volatility in the market for BONE.
Bone ShibaSwap (BONE) Price Analysis – Relative Strength Index
The Relative Strength Index is an indicator that is used to find out whether the price of a security is overvalued or undervalued. As per its name, RSI indicators help determine how the security is doing at present, relative to its previous price.
Moreover, it has a signal line which is a Simple Moving Average (SMA) that acts as a yardstick or reference to the RSI line. Hence, whenever the RSI line is above the SMA, it is considered bullish; if it’s below the SMA, it is bearish.
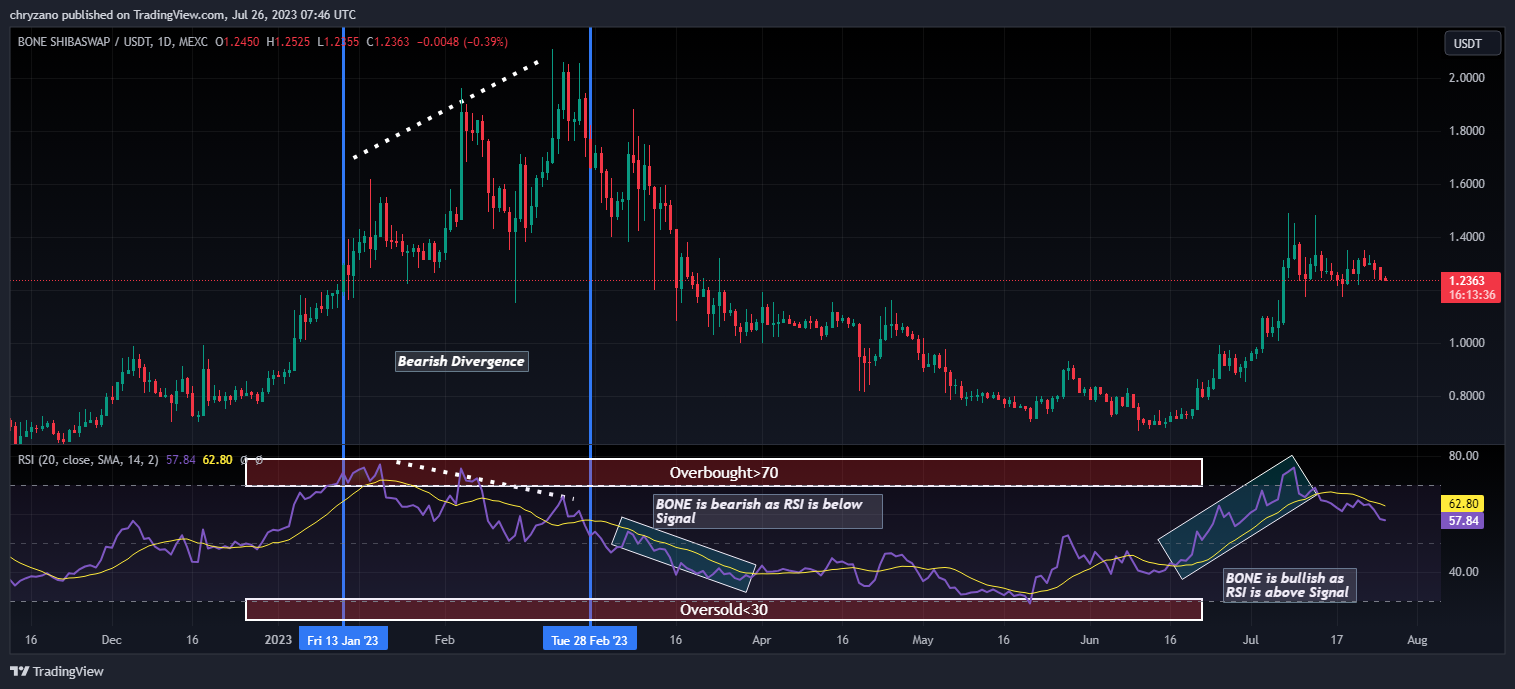
Currently, the RSI reads a value of 58.15 and it is below the signal line. Since the RSI is below the signal, we could adjudicate BONE to be bearish. However, the RSI is positioned parallel to the horizontal line, as such, BONE could be consolidating for some time. Nonetheless, if the RSI keeps on falling, then we could expect it to reach somewhere close to 30 before rising again.
Moreover, the chart shows a bearish divergence where RSI makes lower highs while BONE makes higher highs.
Bone ShibaSwap (BONE) Price Analysis – Moving Average
The Exponential Moving averages are quite similar to the simple moving averages (SMA). However, the SMA equally distributes down all values whereas the Exponential Moving Average gives more weightage to the current prices. Since SMA undermines the weightage of the present price, the EMA is used in price movements.
The 200-day MA is considered to be the long-term moving average while the 50-day MA is considered the short-term moving average in trading. Based on how these two lines behave, the strength of the cryptocurrency or the trend can be determined on average.
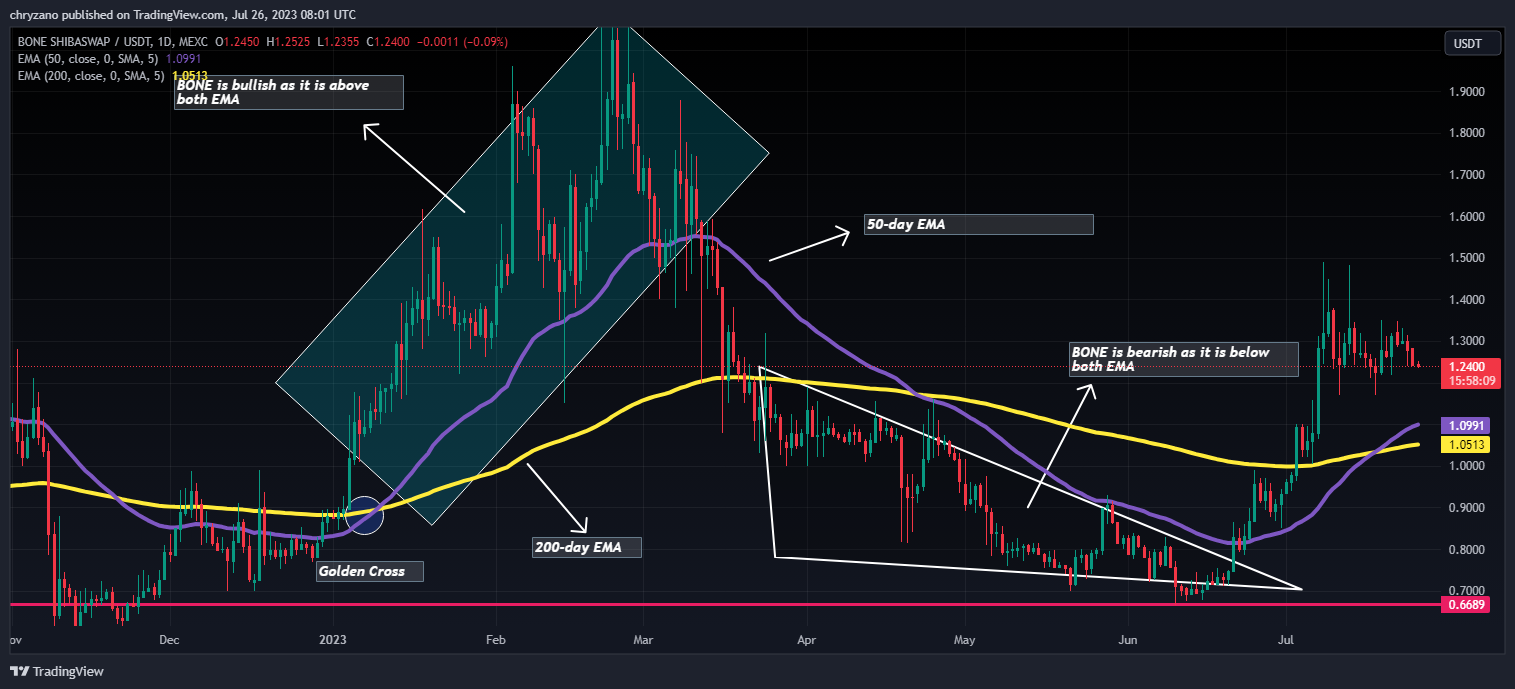
In particular, when the short-term moving average (50-day MA) approaches the long-term moving average (200-day MA) from below and crosses it, we call it a Golden Cross.
Contrastingly, when the short-term moving average crosses the long-term moving average from above then, a death cross occurs.
Usually, when a Golden Cross occurs, the prices of the cryptocurrency will shoot up drastically, but when there’s a Death Cross, the prices will crash.
Currently, BONE is trading above both Exponential Moving Averages. Since BONE seems to be currently dominated by the bears we may see t crash. In the event that BONE crashes, it may seek support from the 50-day EMA and if it breaches the 50-day EMA, it may land on the 200-day EMA. However, based on the historic behavior of BONE, it could be noted that the 200-day EMA has not been a great support. Hence, BONE could fall below that too.
Bone ShibaSwap (BONE) Price Analysis – Elder Force Index
Elder Force Index is an indicator that was invented by Alexander Elder, who was an entrepreneur. The indicator mainly uses two parameters to adjudicate the buying and selling force and thereby predicts the market trend. In particular, it relies on price change and volume. As such the strength of the buying force or selling force is dependent on either the price change or the volume.
Whenever the EFI is greater than zero, or positive, we could say that the trend is bullish, as there is more buying pressure. However, when the EFI is in the negative zone, we could say that the cryptocurrency is in the negative zone and the selling pressure is more.
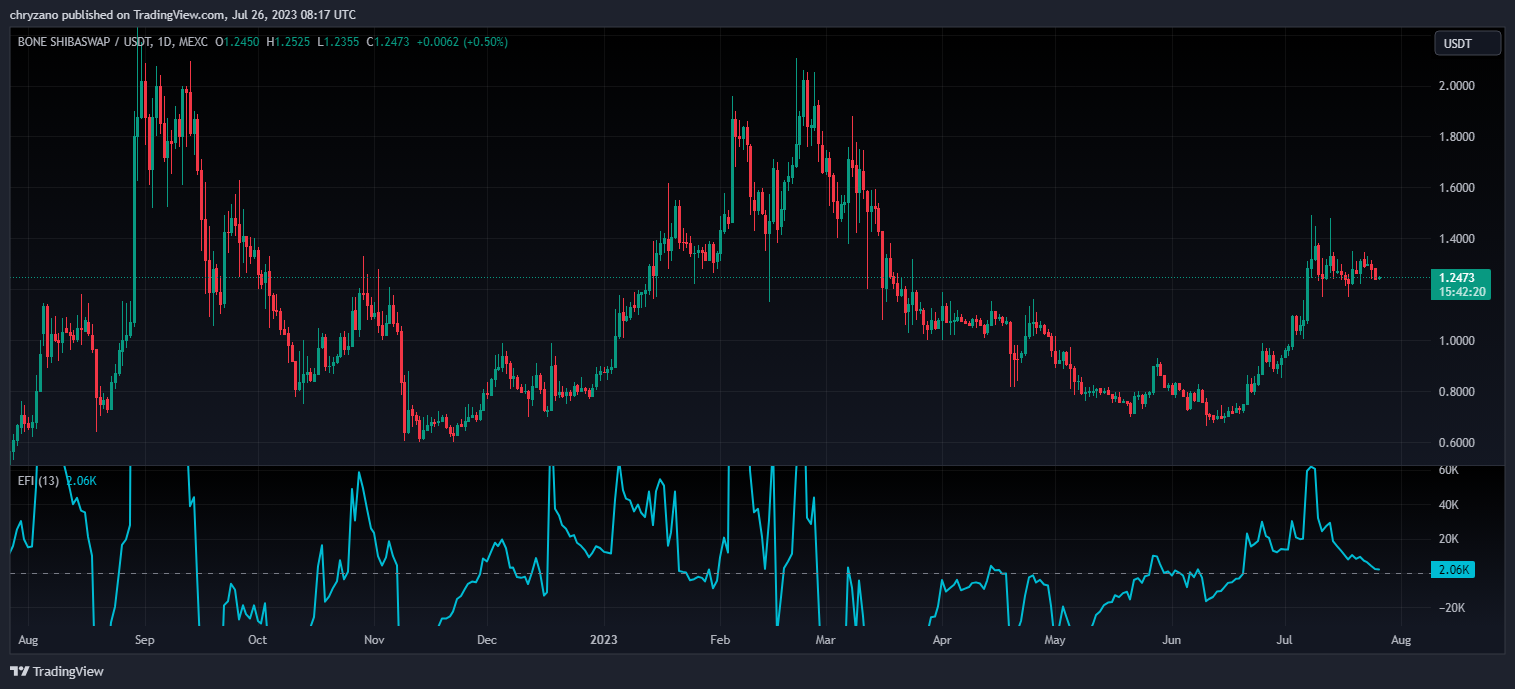
The EFI reads a value of 1.933K and the line is heading towards the negative direction. Moreover, BONE has shed a good portion of its price as such the traders seems to be exiting the market. However, the market will reach an equilibrium once BONE reaches its lowest price. Then the buyers will enter the market and uplift BONE’s price.
Moreover, the EFI inddicator shows a bullish divergence in the chart above. When the EFI indicator was making higher highs, BONE was making lower highs.
Bone ShibaSwap (BONE) Price Prediction 2023-2030 Overview
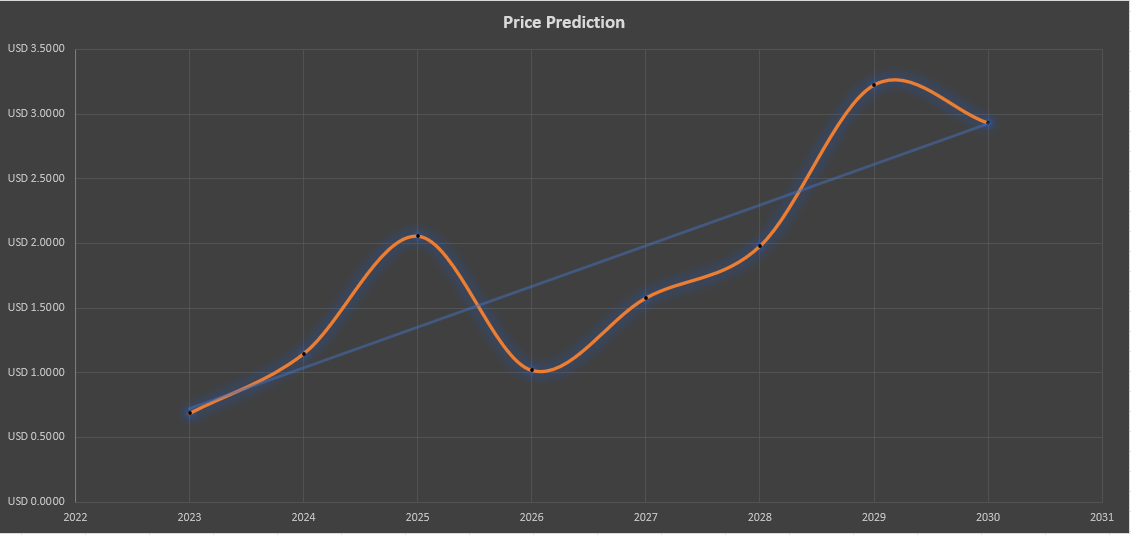
| Year | Minimum Price | Average Price | Maximum Price |
| 2023 | $0.6250 | $0.6855 | $0.7125 |
| 2024 | $0.950 | $1.1463 | $1.250 |
| 2025 | $1.750 | $2.0561 | $2.500 |
| 2026 | $0.75 | $1.0176 | $1.125 |
| 2027 | $1.100 | $1.5784 | $1.850 |
| 2028 | $1.600 | $1.9808 | $2.125 |
| 2029 | $2.575 | $3.2262 | $3.555 |
| 2030 | $2.650 | $2.9293 | $3.250 |
| 2040 | $5.5000 | $6.0079 | $6.250 |
| 2050 | $8.75 | $9.1460 | $10.500 |
Bone ShibaSwap (BONE) Price Prediction 2023
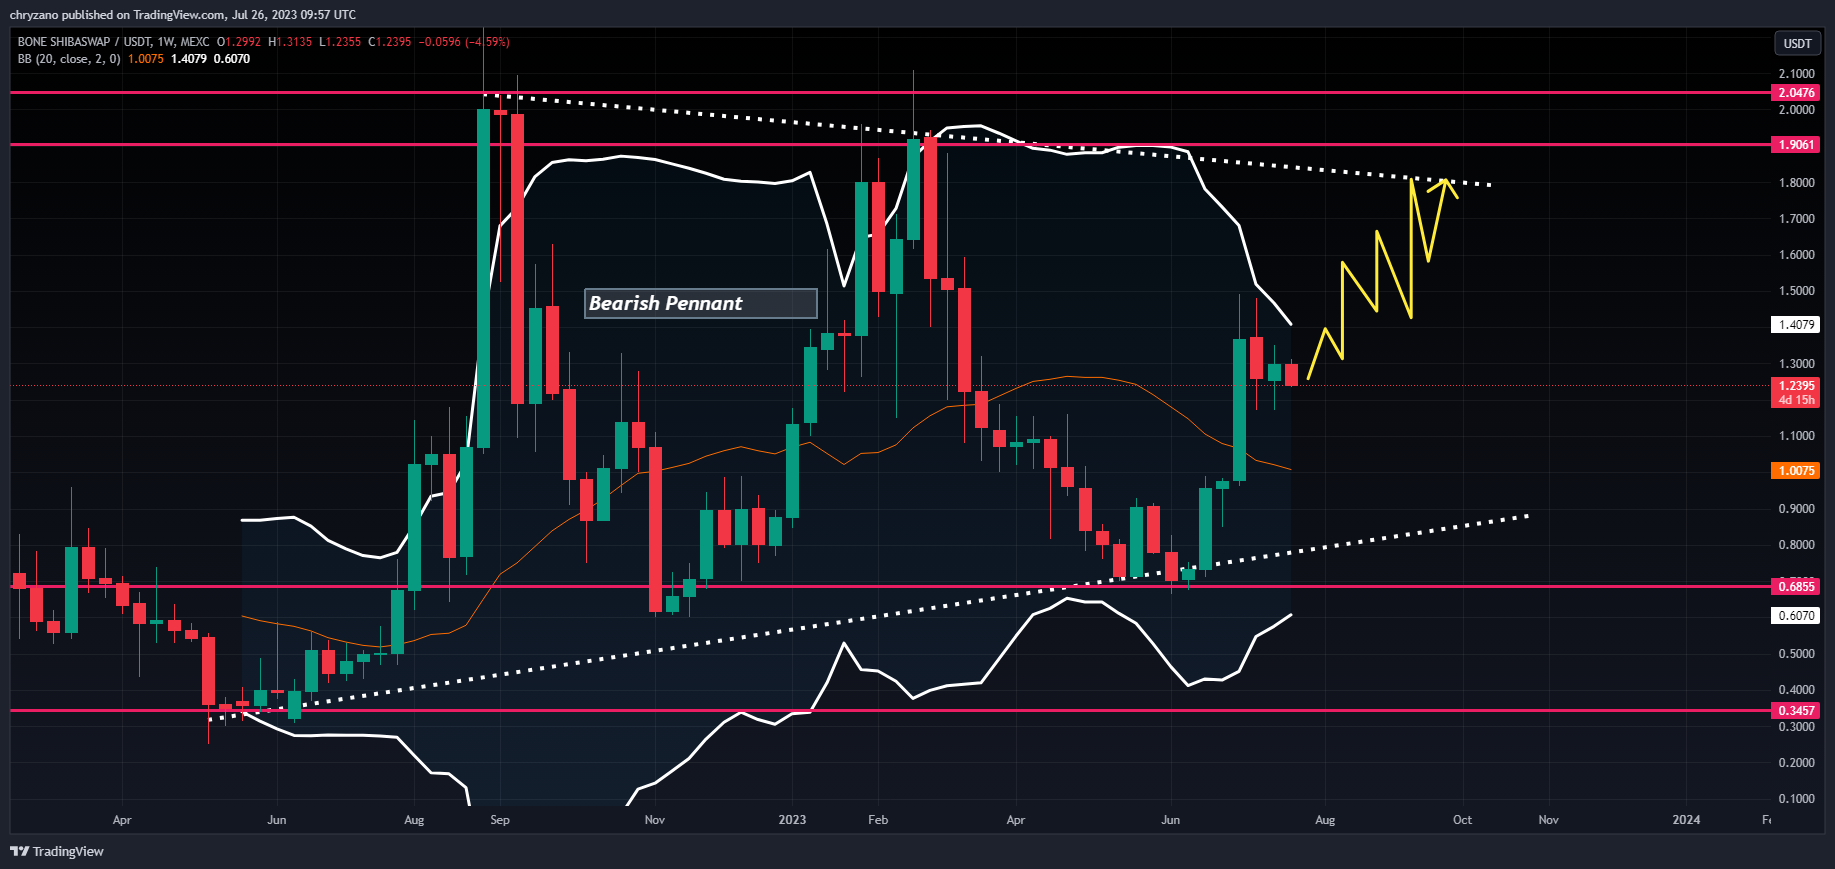
When considering the longer time frame for BONE, it could be noted that BONE is trading inside a bearish pennant. More importantly BONE made higher lows while the highs it made did not show much difference in height. After kissing the lower trend line BONE is currelty above the SMA of the Bollinger band.
Since BONE is retracing, we may see it seeking for support from the SMA before reaching the upper band. However, there wont be a sudden drop of price as the Bollinger bands are squeezing, hence, the lack of high volatility. We may see BONE rebound off of the upper and lower trendline before breaking out of the bearish pennant.
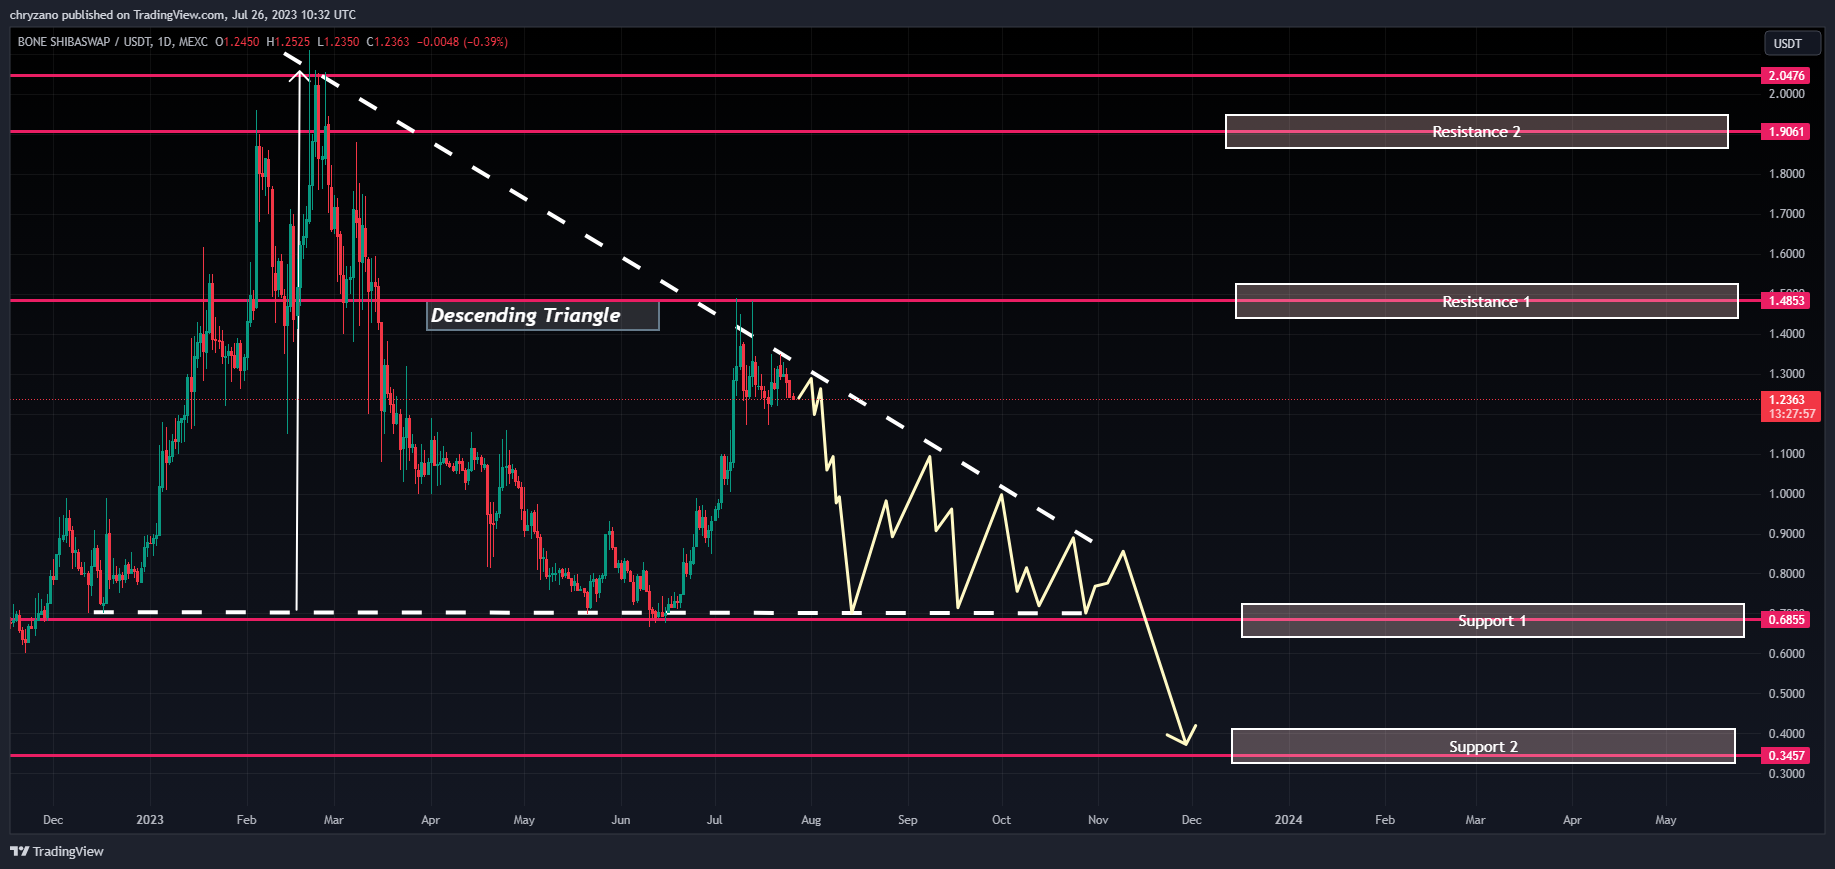
The shorter time frame chart shows how BONE is trading inside the descending triangle. If follows the conventional way of forming the descending triangle, we could expect it to rebound off of both trendlines on and off. And, after completely forming the descending triangle it could break out. As such we coud expect BONE to reack the lower trendline which is at Support 1 at $0.6855. If BONE succeeds in breaking this level, then, it may seek the assistance of Support 2 at $0.3457.
However, if BONE bulls interrupt the formation of this triangle and come to BONE’s rescue, then it may rise ti Resistance 1 at $1.4853. If the bulls persist then BONE would have the strength to break Resistance 1 and move onto Resistance 2 at $1.9061.
Bone ShibaSwap (BONE) Price Prediction – Resistance and Support Levels
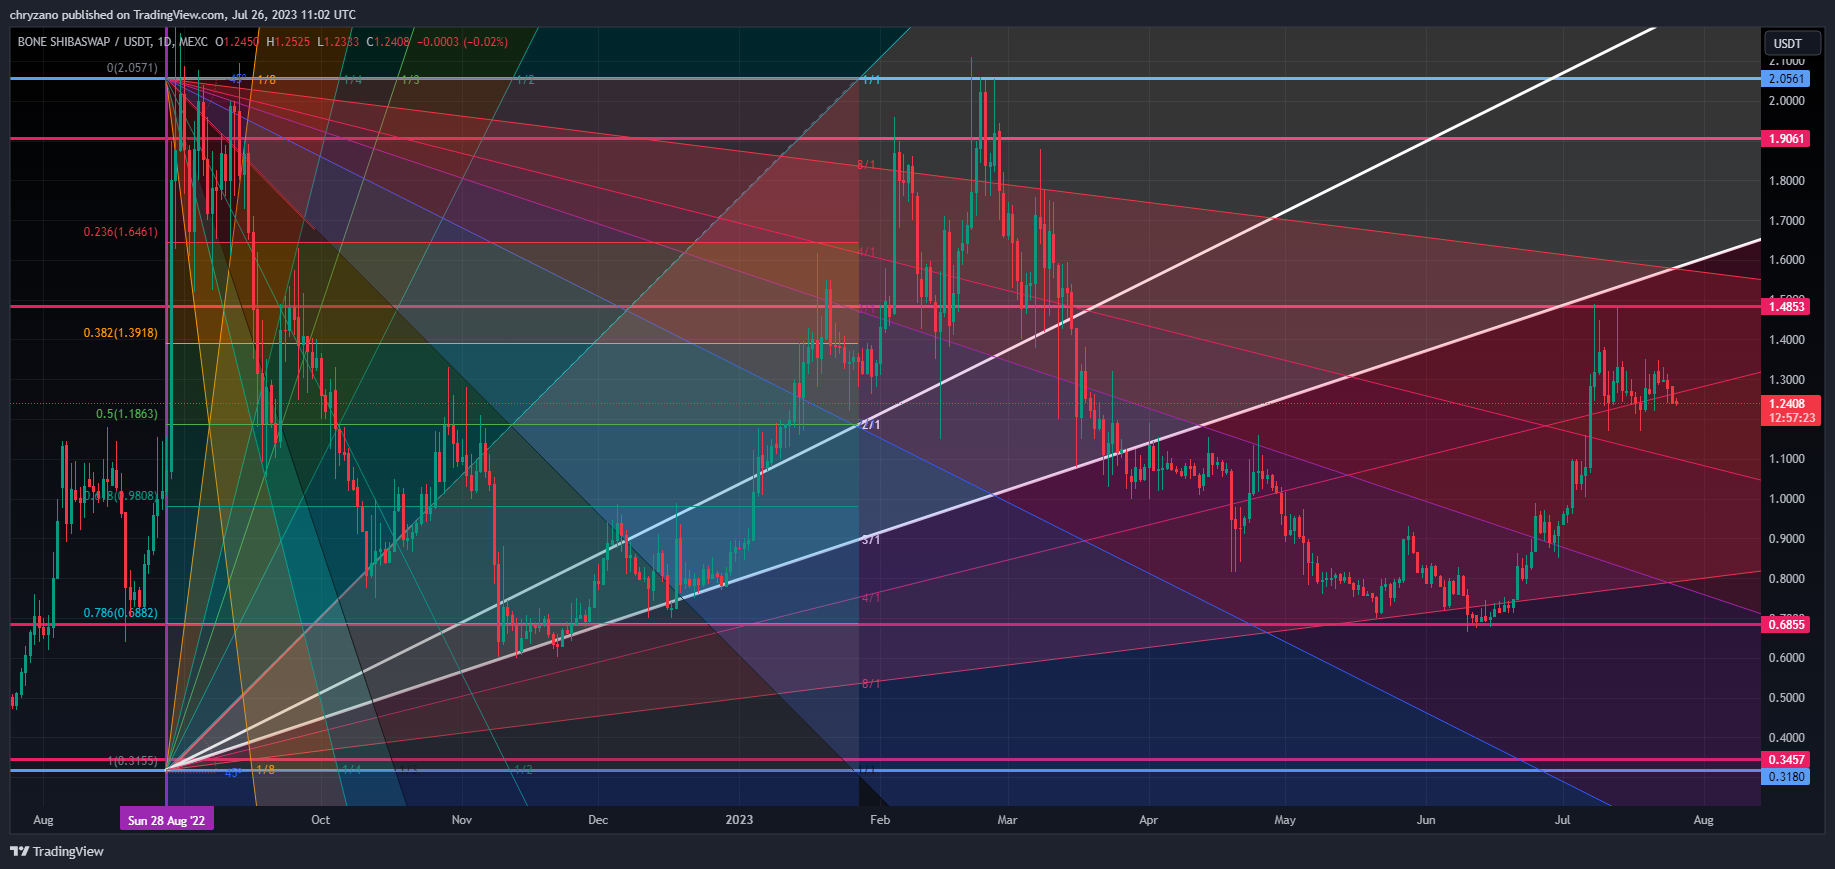
The above chart shows BONE’s behavior since August 2022. BONE started descending just below the 1:1 Gann line. However, since the bears were too powerful, BONE broke the 1:2 resistance level and eventually reached the 1:3 Gann line.
Come November 2022, BONE bulls got into action and rose along the 3:1 Gann line. With the dawn of 2023, the bulls were fire up as they pushed BONE above the 2:1 Gann line resistance level. Unfortunately, BONE wasnt able to test the 1:1 Gann line.
After reaching its highest price in February 2023 BONE started descending, it crashed vertically before starting to descend diagonally just below the 3:1 Gann line . Currently, it is being support by the 4:1 Gann line and it may continue to rise. However, as the chart above shows BONE in a descending triangle it could seek support from the 8:1 Gann line.
Bone ShibaSwap (BONE) Price Prediction 2024
There will be Bitcoin halving in 2024, and hence we should expect a positive trend in the market due to user sentiments and the quest by investors to accumulate more of the coin. However, the year of BTC halving didn’t yield the maximum BONE based on the previous halving. Hence, we could expect BONE to trade at a price not below $1.14 by the end of 2024.
Bone ShibaSwap (BONE) Price Prediction 2025
BONE may experience the after-effects of the Bitcoin halving and is expected to trade much higher than its 2024 price. Many trade analysts speculate that BTC halving could create a huge impact on the crypto market. Moreover, similar to many altcoins, BONE will continue to rise in 2025 forming new resistance levels. It is expected that BONE would trade beyond the $2.05 level.
Bone ShibaSwap (BONE) Price Prediction 2026
It is expected that after a long period of bull run, the bears would come into power and start negatively impacting the cryptocurrencies. During this bearish sentiment, BONE could tumble into its support regions. During this period of price correction, BONE could lose momentum and be way below its 2025 price. As such it could be trading at $1.01 by 2026.
Bone ShibaSwap (BONE) Price Prediction 2027
Naturally, traders expect a bullish market sentiment after the crypto industry was affected negatively by the bears’ claw. Moreover, the build-up to the next Bitcoin halving in 2028 could evoke excitement in traders. However, that excitement has not been reciprocated in BONE. As such, we could expect BONE to trade just below its 2026 value at around $1.57 by the end of 2027.
Bone ShibaSwap (BONE) Price Prediction 2028
As the crypto community’s hope will be re-ignited looking forward to Bitcoin halving like many altcoins, BONE may reciprocate its past behavior during the BTC halving. Hence, BONE would be trading at $1.98 after experiencing a considerable surge by the end of 2028.
Bone ShibaSwap (BONE) Price Prediction 2029
2029 is expected to be another bull run due to the aftermath of the BTC halving. However, traders speculate that the crypto market would gradually become stable by this year. In tandem with the stable market sentiment, BONE could be trading at $3.22 by the end of 2029.
Bone ShibaSwap (BONE) Price Prediction 2030
After witnessing a bullish run in the market, BONE and many altcoins would show signs of consolidation and might trade sideways and move downwards for some time while experiencing minor spikes. Therefore, by the end of 2030, BONE could be trading at $2.92
Bone ShibaSwap (BONE) Price Prediction 2040
The long-term forecast for BONE indicates that this altcoin could reach a new all-time high(ATH). This would be one of the key moments as HODLERS may expect to sell some of their tokens at the ATH point.
If they start selling then BONE could fall in value. It is expected that the average price of BONE could reach $6.00 by 2040.
Bone ShibaSwap (BONE) Price Prediction 2050
The community believes that there will be widespread adoption of cryptocurrencies, which could maintain gradual bullish gains. By the end of 2050, if the bullish momentum is maintained, it could hit $9.15
Conclusion
If investors continue showing their interest in BONE and add these tokens to their portfolio, it could continue to rise. BONE’s bullish price prediction shows that it could reach the $0.7 level.
FAQ
Bone ShibaSwap (BONE) is one of the flagship tokens for ShibaSwap, a decentralized ecosystem associated with the Shiba Inu community.
BONE tokens can be traded on many exchanges like OKX, Deepcoin, Bitget, CoinW, and LBank.
BONE has a possibility of surpassing its present all-time high (ATH) price of $41.67 in 2021.
BONE is one of the few cryptocurrencies that has been losing value in the past seven days. If BONE continues this streak, it may be difficult for BONE to reach $0.7.
BONE has been one of the most suitable investments in the crypto space. It is highly volatile, as such, it has quite a margin when its price fluctuates. Hence, traders may be allured to invest in BONE. It’s a good investment in the short term and in the long term as well.
The present all-time low price of BONE is $0.2899.
The maximum supply of BONE is 250,000,000 BONE.
BONE can be stored in a cold wallet, hot wallet, or exchange wallet.
BONE is expected to reach $0.68 by 2023.
BONE is expected to reach $1.14 by 2024.
BONE is expected to reach $2.05 by 2025.
BONE is expected to reach $1.01 by 2026.
BONE is expected to reach $1.57 by 2027.
BONE is expected to reach $1.98 by 2028.
BONE is expected to reach $3.22 by 2029.
BONE is expected to reach $2.92 by 2030.
BONE is expected to reach $6 by 2040.
BONE is expected to reach $9.14 by 2050.
Disclaimer: The views and opinions, as well as all the information shared in this price prediction, are published in good faith. Readers must do their research and due diligence. Any action taken by the reader is strictly at their own risk. Coin Edition and its affiliates will not be held liable for any direct or indirect damage or loss.
More Crypto Price Predictions:
- Stellar (XLM) Price Prediction 2023-2030
- Arweave (AR) Price Prediction 2023-2030
- Cardano (ADA) Price Prediction 2023-2030
- Curve DAO (CRV) Token Price Prediction 2023-2030
- Smooth Love Potion (SLP) Price Prediction 2023-2030
Disclaimer: The information presented in this article is for informational and educational purposes only. The article does not constitute financial advice or advice of any kind. Coin Edition is not responsible for any losses incurred as a result of the utilization of content, products, or services mentioned. Readers are advised to exercise caution before taking any action related to the company.
: What Happens If You Use an Unlicensed Platform?")


