


- BTC and ARK saw their prices drop over the past day, while WLD boasted a 3+% price increase.
- At press time, technicals indicated that all three tokens were at a crossroads with regard to their next move.
- The global cryptocurrency market cap dropped 0.99% over the past 24-hours.
Bitcoin (BTC), Ark (ARK), and Worldcoin (WLD) made it onto CoinMarketCap’s trending list over the past 24-hours, but all for different reasons. Both BTC and ARK saw their prices drop over this time, while WLD’s price was able to climb. Furthermore, technical indicators signaled that all three cryptocurrencies were at a crossroads at press time.
Bitcoin (BTC)
In the last 24-hours of trading, BTC’s value dipped by 0.48%, settling at a trading price of $26,976.78 at press time. Despite this minor decline, BTC’s performance for the week showed a positive increase of 2.36%. Furthermore, over the past month, the cryptocurrency has managed to achieve a price rise of more than 3%.
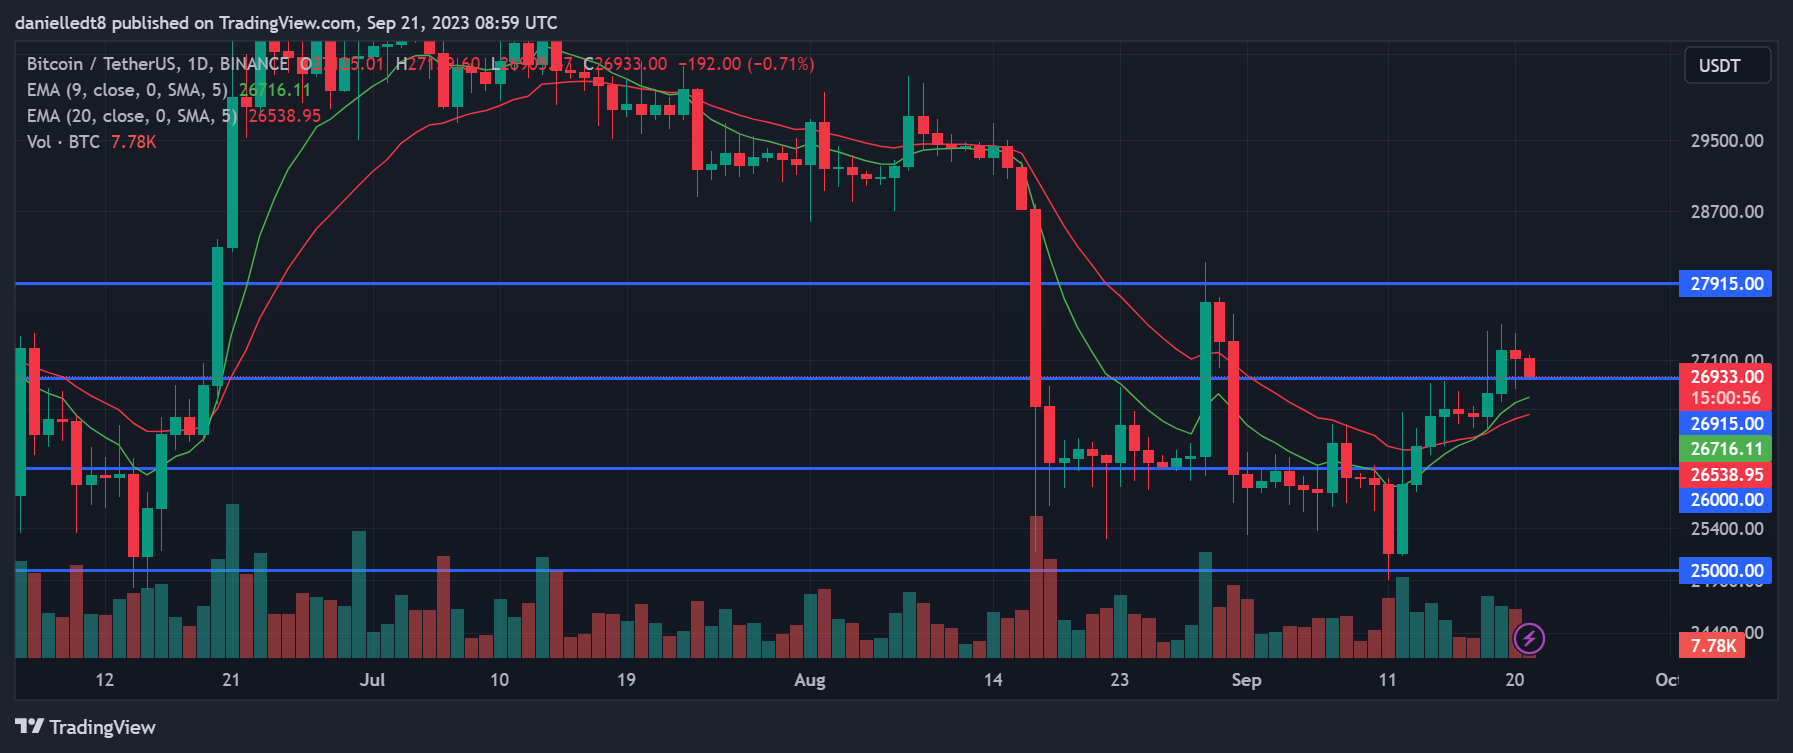
From a technical perspective, BTC was resting on the key $26,915 support level at press time. Should it break below this price point within the next 24-48 hours, then it may be at risk of plummeting down to the $26K mark in the following couple of days.
Thereafter, continued sell pressure may force the leading cryptocurrency’s price below this level towards the critical $25K support level. On the other hand, bulls stepping in to purchase BTC at its current price may boost its value to as high as the $27,915 threshold.
Technical indicators on BTC’s chart were giving mixed signals at press time. On one hand, the 9-day EMA line was positioned bullishly above the 20-day EMA line – suggesting that short-term momentum was in favor of buyers. Meanwhile, the majority of trading volume recorded on BTC’s charts over the past 48 hours has been sell volume.
A daily candle close below $26,915 today may be a confirmation of the bearish thesis. Conversely, BTC closing today’s trading session above this significant benchmark may suggest that BTC’s bullish momentum will continue in the following couple of days.
Ark (ARK)
ARK experienced a significant drop in its price, slipping more than 19% over the past day of trading. At press time, the altcoin was trading at $0.5507, slightly higher than its lowest point in the past 24-hours, which was $0.5322.
On the brighter side, ARK had a successful week, with its price surging more than 91%. Looking at a broader time frame, ARK’s price showed remarkable growth, rising by an impressive 128% over the past thirty days.

Similar to BTC, ARK was also resting on a key support level. At press time, the altcoin’s price had retraced to trade just above the $0.4905 mark. This was after a strong 31+% move on Tuesday propelled the cryptocurrency’s price above this noteworthy price point. Furthermore, technical indicators were also displaying mixed signals on ARK’s daily chart.
The 9-day EMA line was positioned above the 20-day EMA line, which suggested that ARK’s short-term momentum was bullish. However, a significant bearish technical flag was also recently triggered – suggesting that ARK’s price may continue to decline.
Over the past 24-hours, the daily RSI line crossed bearishly below the daily RSI SMA line. This signaled that sellers have recently gained the upper hand on ARK’s daily chart. If this bearish technical flag is validated, then ARK may drop to $0.3575 support in the next few days. Thereafter, continued sell pressure may even force ARK’s price down to $0.2660.
On the other hand, if ARK’s short-term bullish momentum persists, ARK’s price may rebound off of the $0.4905 mark and climb toward $0.8430. A daily candle close above $0.4905 today may validate the bullish thesis. Conversely, failing to close today’s session above this price point may be an early confirmation of the bearish thesis.
Worldcoin (WLD)
The past 24-hours were good for WLD, as its price was able to climb by more than 3% during this time, reaching a trading value of $1.43. Simultaneously, the token’s 24-hour trading volume saw a surge of 86.91%, approaching approximately $183,219,968.
Furthermore, in the past week, WLD witnessed an impressive price surge of more than $41. However, it is worth noting that the cryptocurrency’s performance over the past month showed a slight decline of 3.24%.
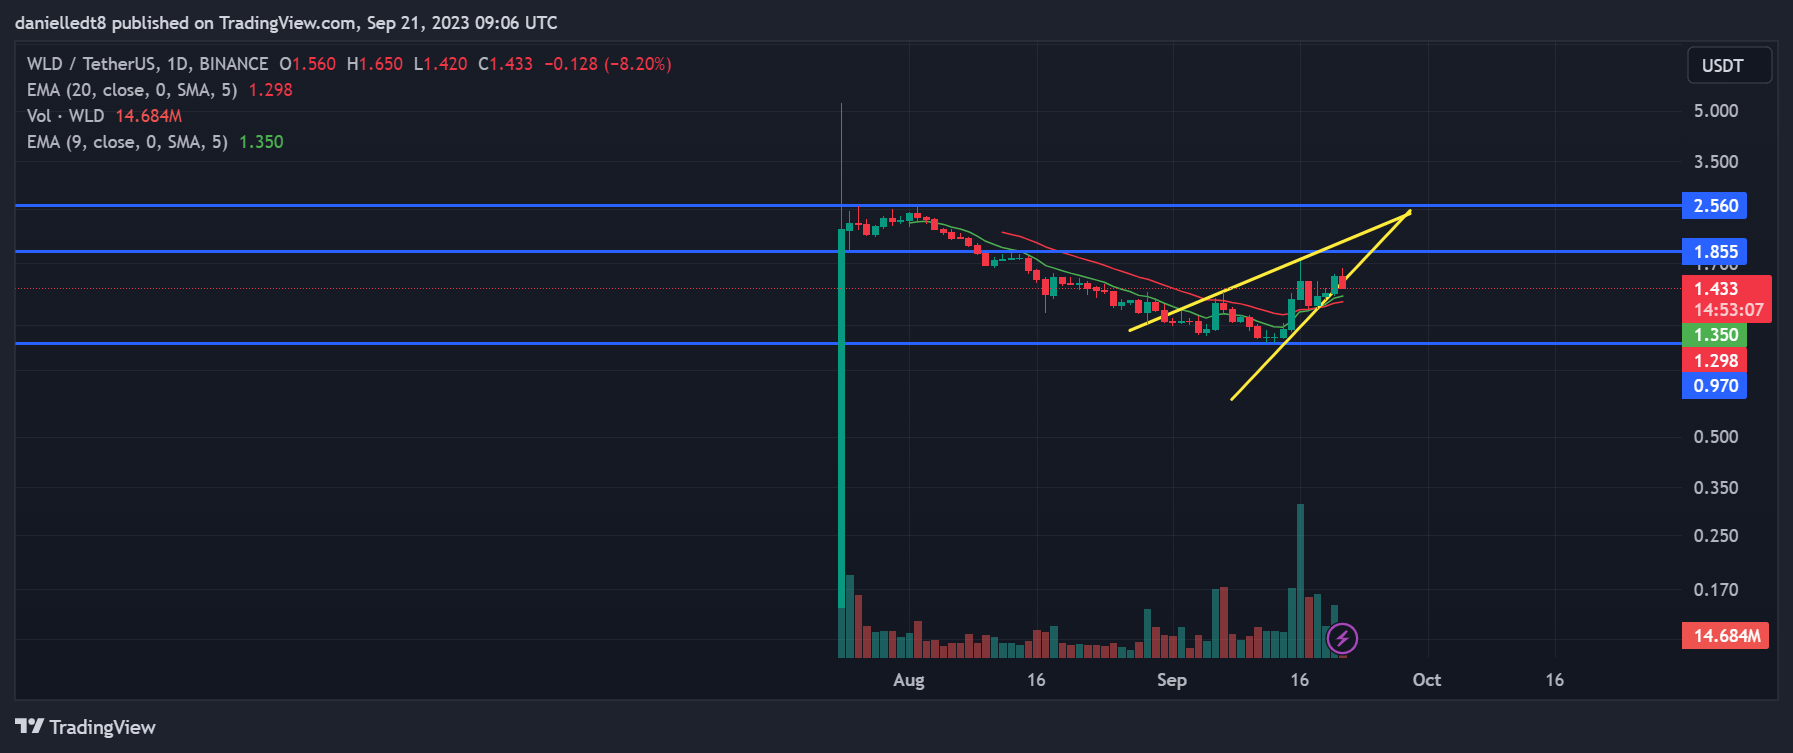
A bearish rising wedge pattern that had formed on WLD’s daily chart suggested that the altcoin’s price may drop in the upcoming week. This was a stark contradiction to the bullish technical flag that was triggered on WLD’s daily chart over the past 72 hours.
During this time, the 9-day EMA line crossed above the 20-day EMA line. This signaled that short-term momentum had shifted in favor of buyers. If this technical flag is validated, then the cryptocurrency price may have the support needed to flip the $1.855 resistance level into support. Thereafter, continued buy pressure could elevate WLD to $2.560 as well.
On the other hand, if the bearish chart pattern is validated, then WLD’s price may fall to the immediate support level of $0.970. A potential early indication of this bearish scenario playing out will be if WLD breaks below the 9-day EMA line, which was situated around $1.352 at press time.
Overall, the global cryptocurrency market cap dropped 0.99% over the past 24-hours. Subsequently, the market’s valuation was estimated to be $1.07 trillion at press time. Along with the decrease in value, the market also experienced a decline in its daily trading volume.
CoinMarketCap data indicated that the 24-hour trading volume for the market dropped 2.53%. As a result, the total stood at $27.85 billion.
Disclaimer: The views and opinions, as well as all the information shared in this price analysis, are published in good faith. Readers must do their own research and due diligence. Any action taken by the reader is strictly at their own risk. Coin Edition and its affiliates will not be held liable for any direct or indirect damage or loss.
Disclaimer: The information presented in this article is for informational and educational purposes only. The article does not constitute financial advice or advice of any kind. Coin Edition is not responsible for any losses incurred as a result of the utilization of content, products, or services mentioned. Readers are advised to exercise caution before taking any action related to the company.


