
- CEO of XOR Strategy tweeted that the bear market lasted only for one year, followed by three years of bull run.
- BTC could hit 350K in the next halving scheduled for May 2024, states Ohayon.
- The bears are in on BTC. The bulls may need something extra special to stop the bears.
Chief Executive Officer (CEO) of XOR Strategy, Aurelien Ohayon, tweeted that bear markets last only one year with each halving that happens once in four years. The rest of the three years were followed by bull runs sped by halving, stated the CEO in the tweet.
When taking a closer look at the image shared on the above tweet, it could be seen that the gradient of BTC rose with the beginning of every halving process as shown in the second rectangle within the three years.
Meanwhile, the tweet points out that, at present, BTC is in the beginning phase of the first rectangle. With its halving process scheduled for May 2024, as per reports, Ohayon predicts BTC to hit $350K after the impending halving.
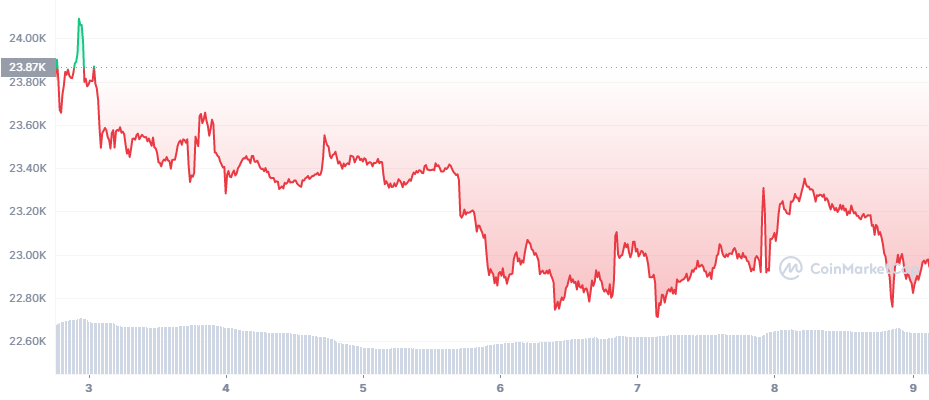
When taking a look at the chart below, BTC just had a peep into the green zone on the first day of the week. After opening the market with its price at $23.87K, the coin rose to $24.10K within a few hours. However, after its brief stay in the green zone, BTC bulls could not contend with the bears who pulled the prices into the red zone.
While BTC was fluctuating in the red zone, the bulls tried their level best, but they were only able to consolidate the prices for three days. On the fourth day, the price fell from $23,370 to $22,760. But it is worth noting that the volume of the BTC had very little fluctuation throughout the week.
As shown in the chart below with blue candlesticks, BTC traded, taking similar patterns in the second half of January. BTC mimicked its behavior from January 14 to 20 and again during January 20-27. However, the latter fluctuation happened near support 1, while the earlier fluctuation happened near support 2.
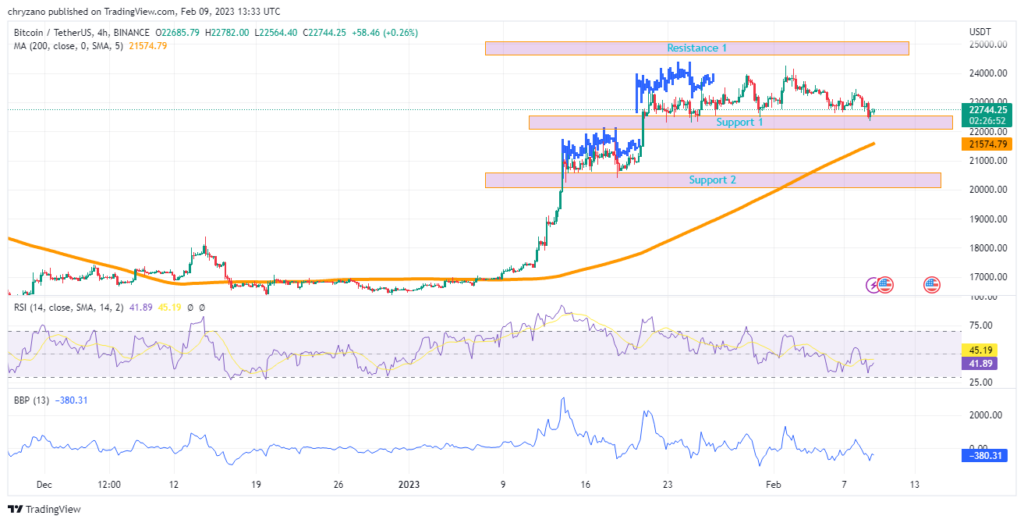
At present, BTC is moving sideways between Support 1 and Support 2. It has been rebounding on Support 1, but the bear bull power records -379 and is titled downwards, indicating that the bears are gaining power.
If that is the case, will Support 1 be strong enough to hold BTC? If so, for how long will it support BTC? From another perspective, if BTC breaks support 1, the 200-day MA may interject it from tanking to support 2. Contrastingly, if the bulls pull something special, BTC will reach resistance 1. Can the bulls negate the increasing bear pressure?
Disclaimer: The views and opinions, as well as all the information shared in this price analysis, are published in good faith. Readers must do their own research and due diligence. Any action taken by the reader is strictly at their own risk, Coin Edition and its affiliates will not be held liable for any direct or indirect damage or loss.
Disclaimer: The information presented in this article is for informational and educational purposes only. The article does not constitute financial advice or advice of any kind. Coin Edition is not responsible for any losses incurred as a result of the utilization of content, products, or services mentioned. Readers are advised to exercise caution before taking any action related to the company.


