


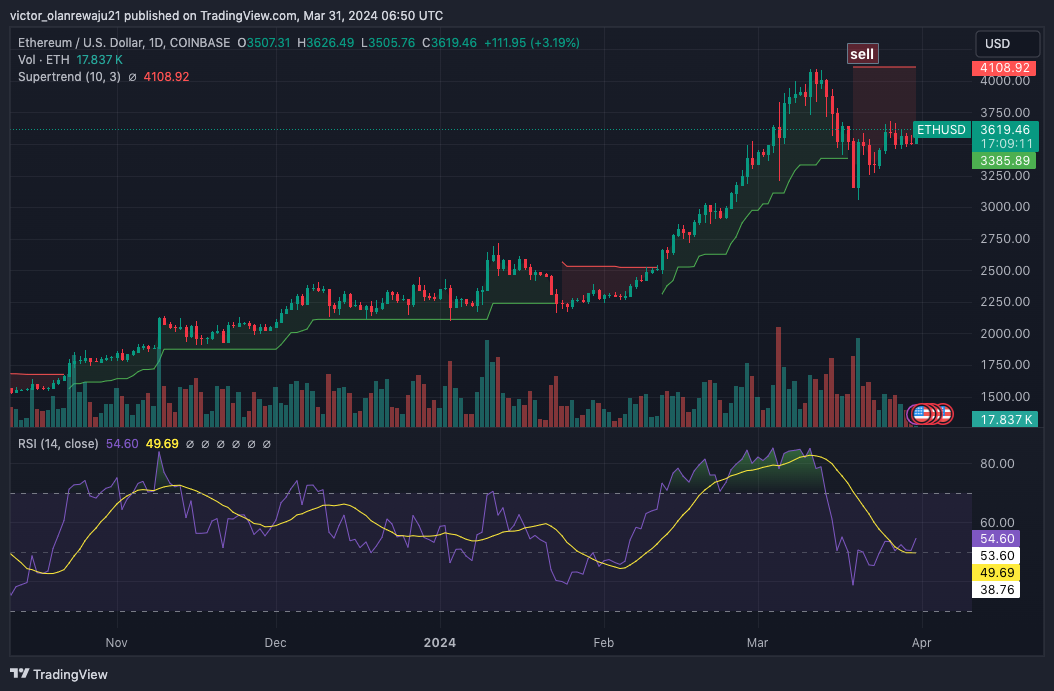
- Bitcoin might attempt a 16.92% increase while ETH could face resistance if its approaches $4,200
- CORE was overbought, suggesting that profit-taking might drag it down to $1.01.
- ORDI’s extension might be hindered by the struggling momentum the MACD displayed.
Bitcoin (BTC) reclaimed $70,000 in the early hours of March 31 after an earlier decline. Likewise, Ethereum (ETH), which dropped below $3,500, was able to find its way back to $3,614 at press time.
But those were not the only major moves in the market as BTC and ETH seemed to influence certain hikes. First on the list was Core (CORE), the native token of a Layer-1 blockchain built on Ethereum, and compatible with the Ethereum Virtual Machine (EVM).
As of this writing, CORE’s price was $1.61, representing an incredible 36.52% increase in the last 24 hours. The trading volume also increased by 180%, indicating that the price increase was not artificial.
For Bitcoin, its influence was seen in ORDI (ORDI), the BRC-20 token. At press time, ORDI’s value was $73.40, thanks to a 14.75% 24-hour increase. Here, Coin Edition analyzes how these cryptocurrencies might perform in the near term.
Bitcoin (BTC)
On the daily timeframe, Bitcoin exhibited a lack of directional bias as the price hovered around $70,266. However, the chart below displayed how bulls camped at $63,965 on March 25, helping to create support at the level.
Furthermore, the technical formation of the Exponential Moving Average (EMA) suggested a bullish thesis for BTC. This was because the 20 EMA (blue) had crossed over the 50 EMA (yellow), indicating a golden cross.
However, a correction might occur if Bitcoin drops below the 20 EMA at $68,857. If this is the case, Bitcoin’s price might drop as low as $60,800. On the other hand, if bulls sustain the price above $69,000, BTC might climb by 16.92% before the new week closes.
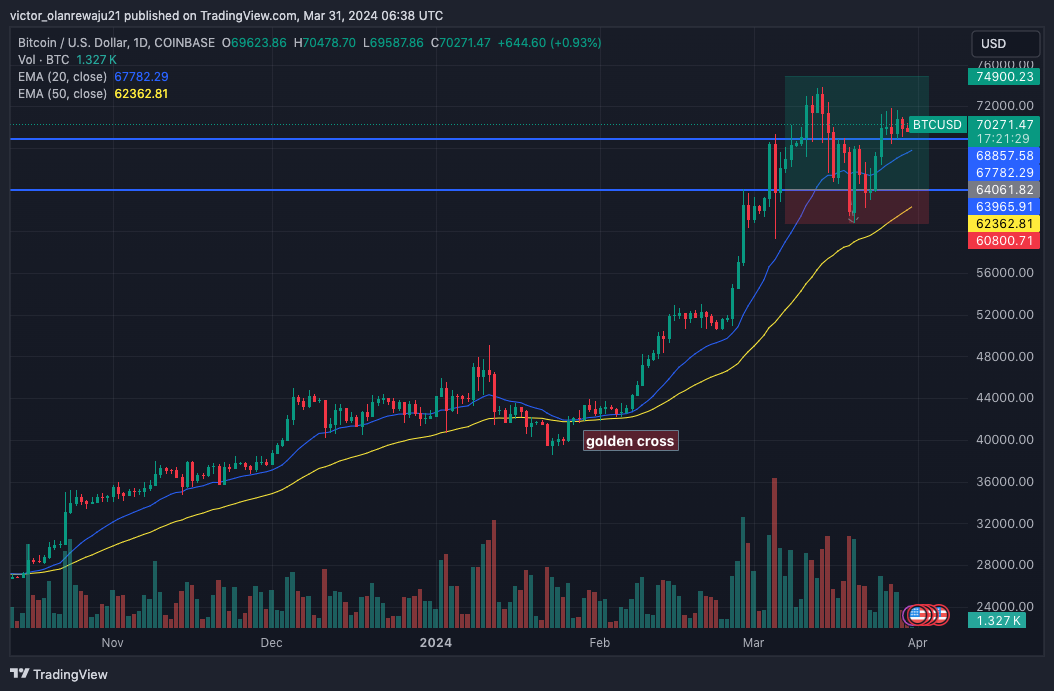
Should this happen, the coin would hit another all-time high at $74,900. Regardless of the outcome, traders need to be wary of volatility considering that the halving is scheduled for April. With extreme volatility, BTC might experience massive price fluctuations which could flush out over-leveraged contracts.
Ethereum (ETH)
The ETH/USD daily chart revealed how bears almost forced the altcoin to an oversold region on March 19. As of this period, the Relative Strength Index (RSI) was 38.13 while ETH changed hands at $3,126.
But bulls came to the cryptocurrency’s rescue with the RSI displaying a rising buying momentum. If the momentum continues to trend higher, the price of ETH might extend above $4,000 within a few days.
The Supertrend agreed with the forecast. But the same indicators flashed a sell signal at $4,108. Therefore, while ETH’s price might climb, resistance around the aforementioned region could stop it from hitting a new all-time high this week.
Core (CORE)
CORE’s uptrend started as far back as March 23, with green candlesticks displayed on the daily chart. Although there was a pullback to $0.95 on March 28, bulls were able to clear the resistance within a short while.
Currently, this token showed no signs of stopping the upswing. In addition, the Bollinger Bands (BB) revealed that there was high volatility around the cryptocurrency. The BB also indicated that CORE was overbought as the upper band continued to tap the new highs of the token.
Despite the signal shown by the BB, the Moving Average Convergence Divergence (MACD) remained positive. This indicated a bullish momentum for CORE which might foreshadow higher prices.
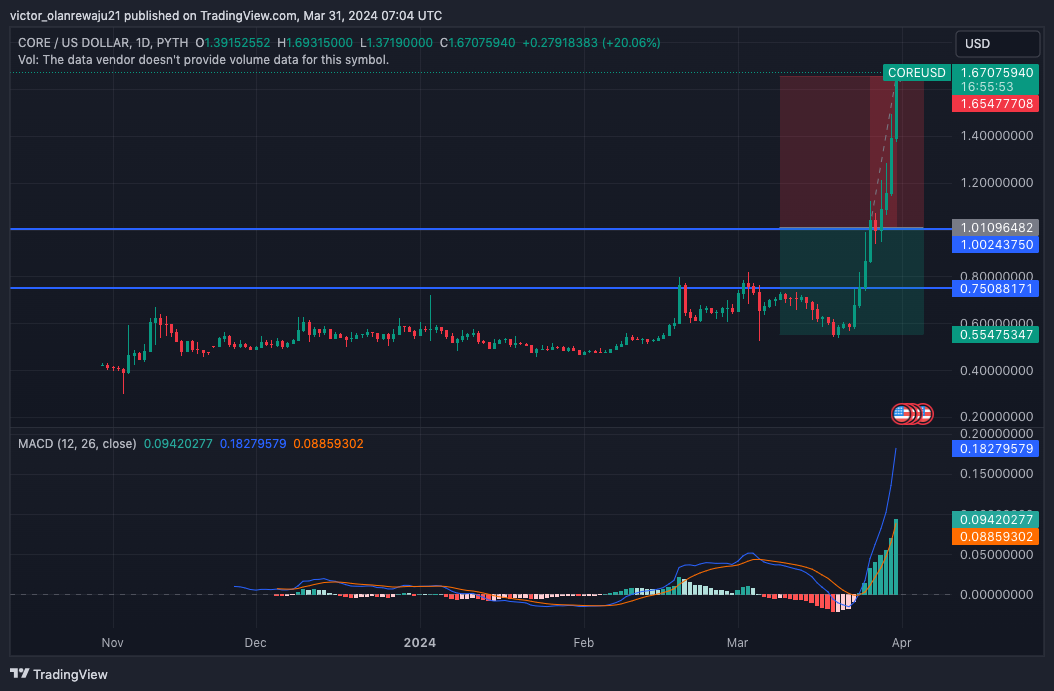
From a bullish perspective, CORE’s price might climb toward $1.75. However, market participants might also decide to book profits. If this is the case, CORE might decrease to $1.01. In a highly bearish situation, the price might fall to $0.75.
ORDI (ORDI)
Bulls’ defense of the $62.17 region ensured that ORDI was able to retest $71.15. However, the uptick might hindered as the token targets a higher level. If bulls try to drive the price higher, ORDI might encounter an overhead resistance at $80.54.
A close above this resistance might send ORDI toward $91.59 within the forthcoming weeks. However, rejection at the resistance could force a retracement which could see ORDI decline below $63.79.
The Money Flow Index (MFI) supported the bullish thesis as its reading increased. However, if the reading taps an overbought point, ORDI’s trend might reverse downwards.
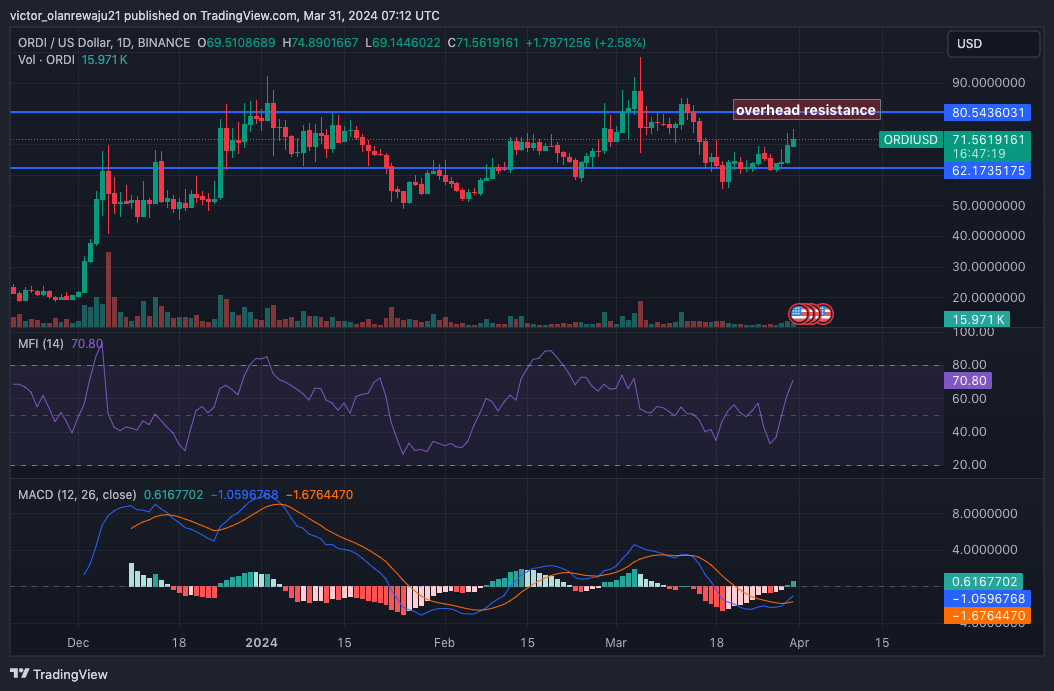
Meanwhile, the MACD showed that there was no clear path yet for a further upswing as the 12 and 26 EMAs were below the zero midpoint. If the EMAs rise into positive territory, then the bullish bias might be confirmed. Conversely, being stuck in the red zone might drag ORDI back.
Disclaimer: The information presented in this article is for informational and educational purposes only. The article does not constitute financial advice or advice of any kind. Coin Edition is not responsible for any losses incurred as a result of the utilization of content, products, or services mentioned. Readers are advised to exercise caution before taking any action related to the company.


 Price Prediction 2026, 2027, 2028, 2029, 2030-2050")

