


- Recent research suggests that bulls are growing fatigued as bears take control of the market.
- Prices for Bitcoin, Ethereum, Dogecoin, XRP, and Sol have fallen during the past day.
- As far as the indicators go, bearishness is only going to increase.
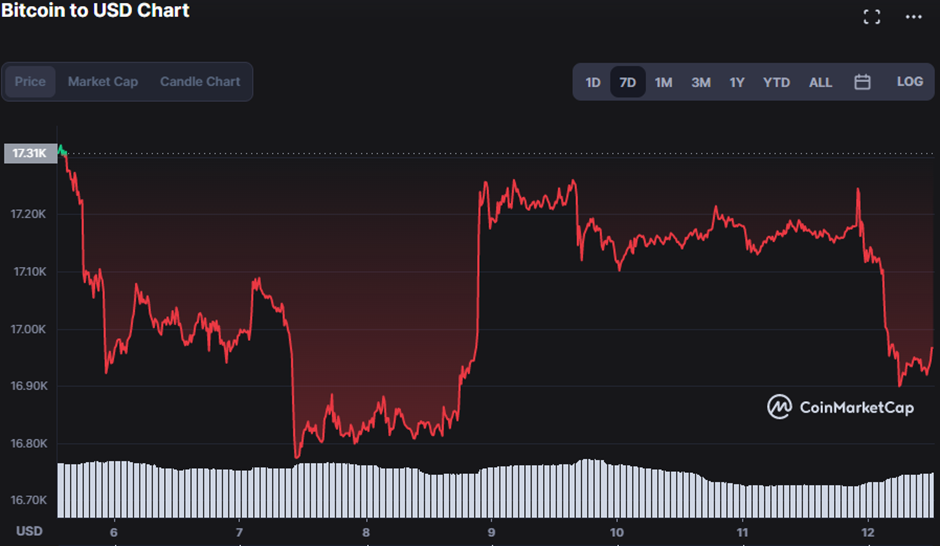
Cryptocurrencies have seen quite a dramatic year with intense and mind-blowing news, both positive and negative. Money laundering, fiscal theft, and adoption are just a few examples. But the value of Bitcoin, the most well-known digital currency, keeps going down day by day.
At press time, it had dropped by 1.33%, to $16,947.42. If BTC bulls can push the price above $17,245.64, which is its intraday high, they may see a breakout. BTC’s rising popularity this year could mean big things for the King coin next year as demand increases.
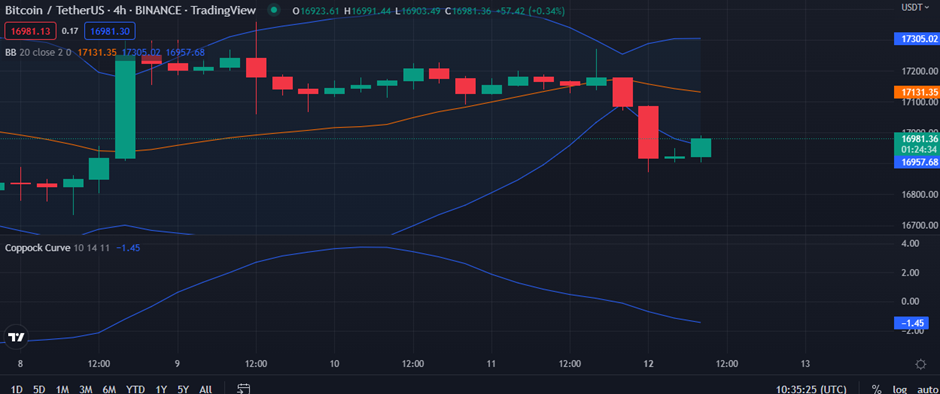
The escalating selling pressure indicated by the bulging Bollinger Bands is adding to the BTC market’s downward trajectory, with the upper band nearing $17306.52 and the lower bands touching $16954.05. The adverse market trend is predicted to continue as the price progresses toward the lower band.
The Coppock Curve, with a value of -1.47 suggesting that bear strength is increasing as it points southward, is also projecting this bear run.
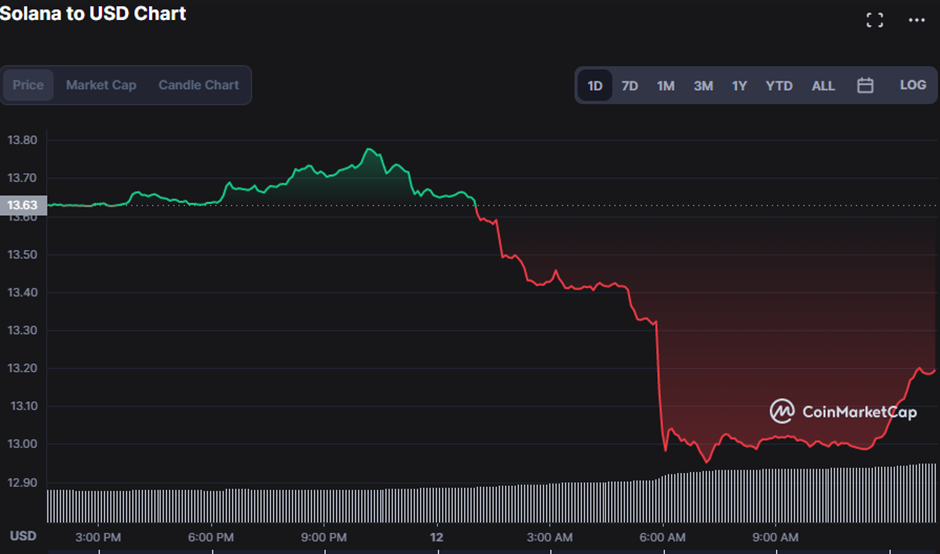
Solana (SOL)
During the day, the bullish trend lost its luster as the bear gained control of the Solana (SOL) market. After ending the day at $13.43, bear influence has managed to drive prices down to $13.19, a 3.19% slump as of press time.
As the MACD line moves deeper into negative territory, the bearish pressure on SOL is forecast to rise. The MACD value of -0.13, which trends below the signal line at -0.07, demonstrates this bearish influence. Even the histogram’s downward trend of -0.06 doesn’t do much to boost morale.
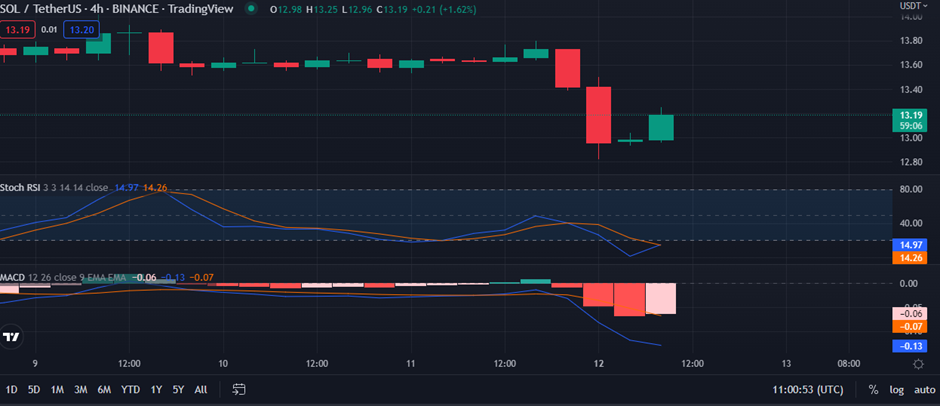
A stochastic RSI value of 15.48 indicates that the current trend is likely to be short-lived, which is good news for investors. Its northward orientation supports this theory, indicating that bulls are fighting to weaken the bears’ proclivity. This, however, is merely a warning to traders to be on the lookout in the near future.
Ethereum (ETH)
Bears continue to rule the Solana (SOL) market, which has resulted in a loss in the price of 1.37%, bringing the current price to $1,255.28.
This slump has been proven by the decreasing market capitalization by 1.36% to $1,255.28 and the strengthening selling pressure indicated by the rise in the 24-hour trading volume by 45.12% to $4,563,113,511 respectively.
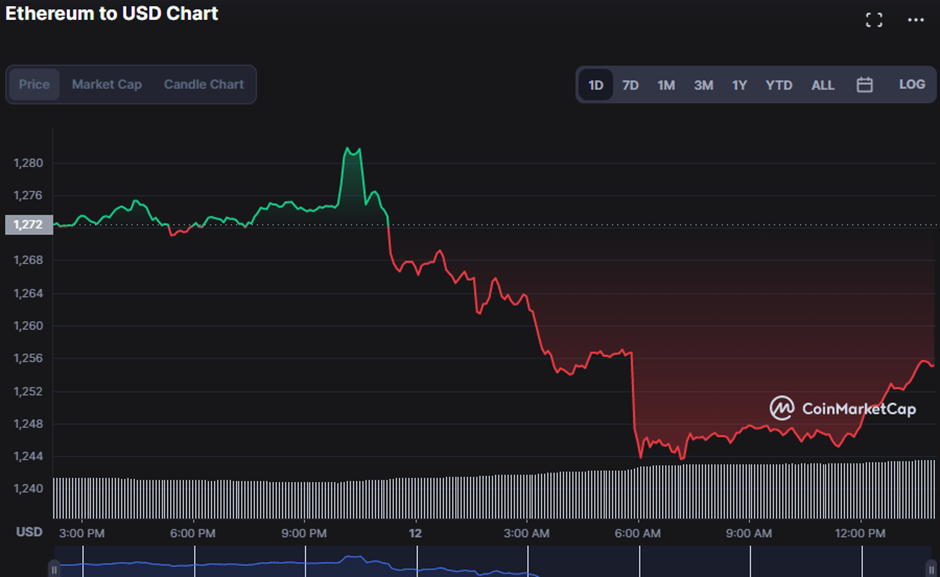
Higher TRIX scores indicate greater momentum, whereas lower TRIX scores indicate less momentum. The 2.20 TRIX reading shows that traders are pessimistic and expect bears to maintain control of the market. If bulls keep up the pressure, however, the price of ETH should climb, as this value is above the zero line and indicates a buy signal.
The Arnaud Legoux moving average (ALMA) follows the market downward while it is trending. When the price and ALMA are both falling at the same moment, a breakout or reversal is signaled when the price rises above the ALMA. The 4-hour Ethereum price chart reveals this discrepancy between ALMA’s reading of 1251.99 and the market price of 1254.62.
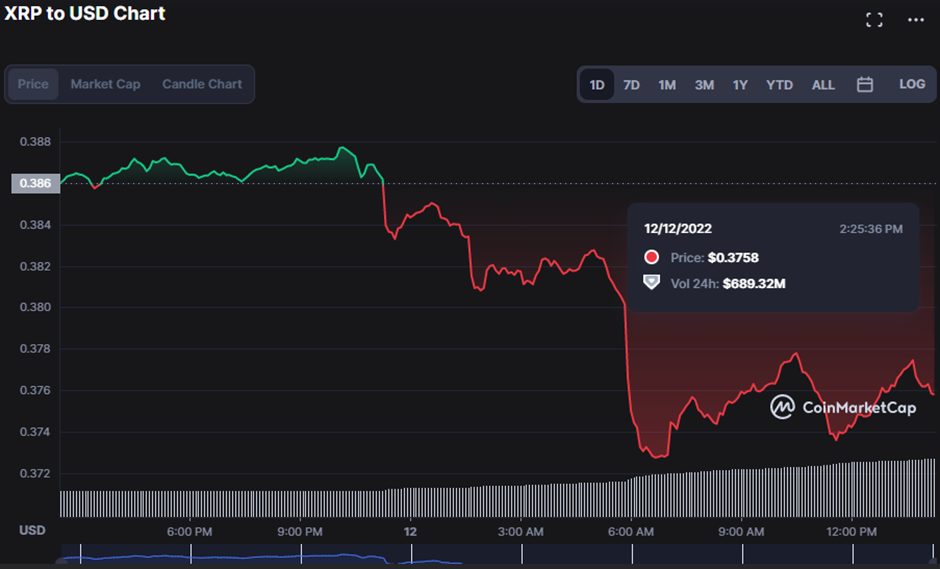
XRP (XRP)
Today, bear dominance has become the norm, with XRP prices falling to support levels of $0.3727. The bears maintain market dominance during the decline, with XRP trading at $0.3752 as it approaches the support level. If the cryptocurrency falls below this support level, it may fall even further if bulls do not intervene.
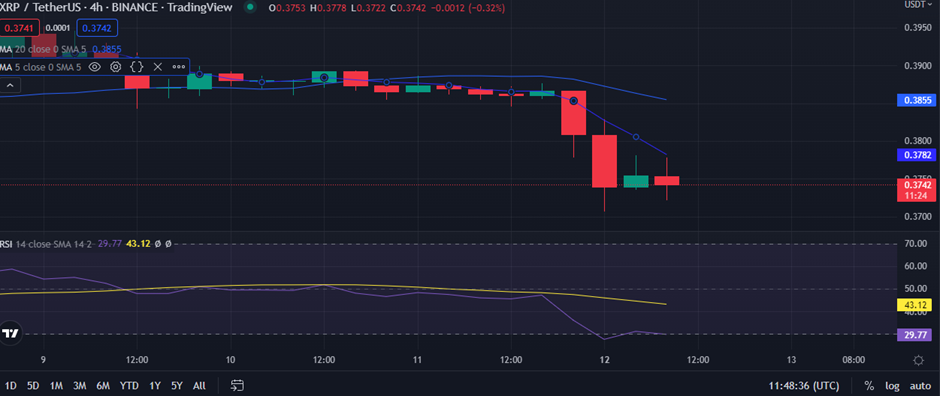
When the 5-day MA drops below the 20-day MA, it’s called a bearish crossing and it indicates that selling pressure is growing in the XRP market. The values of the 5-day and 20-day moving averages (MA) for this bear market are 0.3782 and 0.3855, respectively. Furthermore, the price action below the two moving averages is indicative of a possible predominance of bearish pressure.
A reading of 29.88 on the Relative Strength Index (RSI) indicates that the current trend of the bears surpassing the bulls may endure.
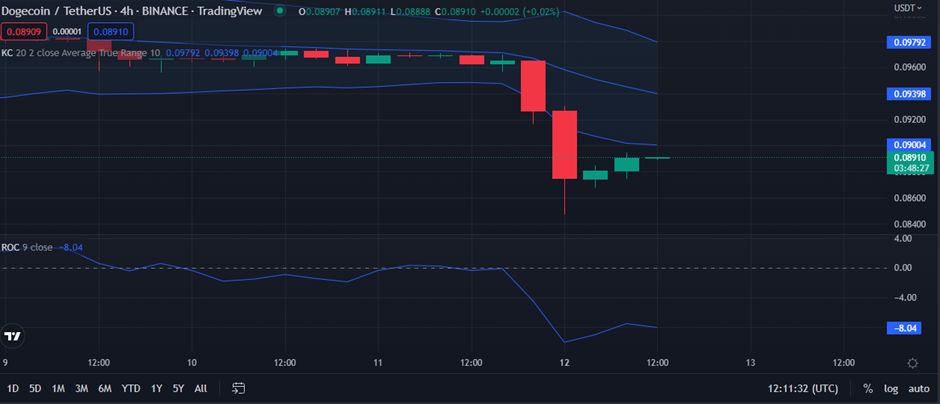
Dogecoin (DOGE)
Dogecoin (DOGE) prices have retraced the most, dropping by 8.19% to $0.089 in the past day. With a drop of 8.17 %, the market capitalization dips to $11,810,924,658.
Trading volume jumped by 242.07% to $714,729,249, which may indicate investors are exiting the market due to escalating selling pressure.
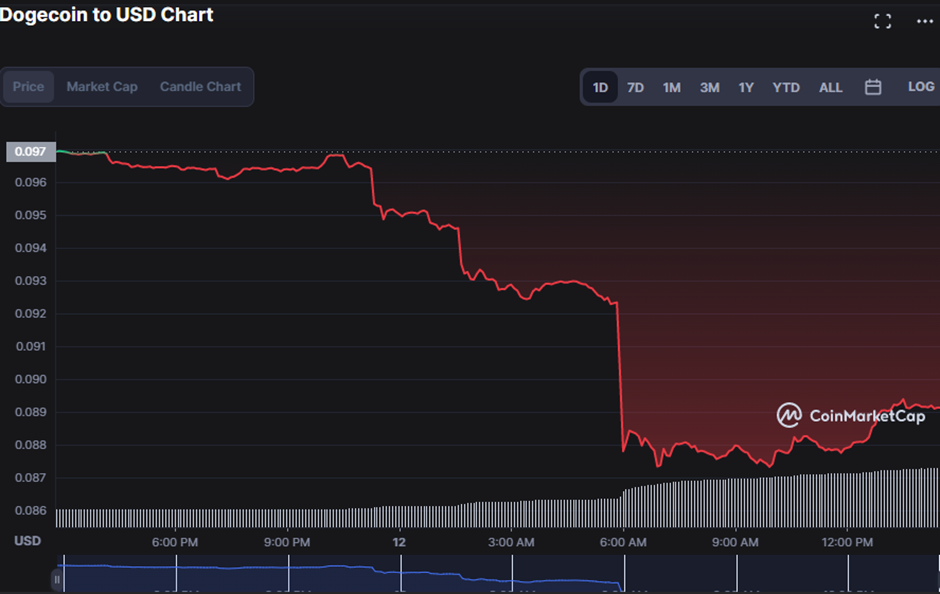
Technical indicators suggest that this bear dominance on the DOGE market is far from ending. This is supported by the southern tendency of the Keltner Channel bands, with the top band hitting 0.09789 and the bottom band touching 0.09004.
As long as the Rate of Change (ROC) remains negative, the bearish trend should continue. As a result, the ROC line in the DOGE price chart, with a value of -8.23, indicates that this momentum will prevail.
In order for BTC, ETH, XRP, DOGE, and SOL trading patterns to try to shift, bulls must maintain the resistance level and push prices higher.
Disclaimer: The views and opinions, as well as all the information shared in this price analysis, are published in good faith. Readers must do their own research and due diligence. Any action taken by the reader is strictly at their own risk, Coin Edition and its affiliates will not be held liable for any direct or indirect damage or loss.
Disclaimer: The information presented in this article is for informational and educational purposes only. The article does not constitute financial advice or advice of any kind. Coin Edition is not responsible for any losses incurred as a result of the utilization of content, products, or services mentioned. Readers are advised to exercise caution before taking any action related to the company.


