


- BTC and ETH prices increased, leading to liquidations worth over $100 million.
- The closeness of the 20 and 50 EMAs suggested that BTC might trade sideways.
- ETH lacked money flow, indicating a possible decline below $3,000.
After experiencing a severe downside for most of the week, Bitcoin (BTC) and Ethereum (ETH) prices recovered in the last 24 hours. At press time, BTC, which had initially slipped below $58,000, was trading at $63,151.
For ETH, it was able to gain 4.26% and rise to $3,116. Previously, the broader market had expected the decline to continue. However, since the cryptocurrencies caught traders off guard, many positions in the derivatives end of the market were liquidated.
According to data from Coinglass, Bitcoin positions worth $60.12 million were wiped out of the market in the last 24 hours. On the other hand, ETH positions wiped out were valued at $40.77 million. Notably, most of the liquidations were shorts who expected the prices to keep falling.
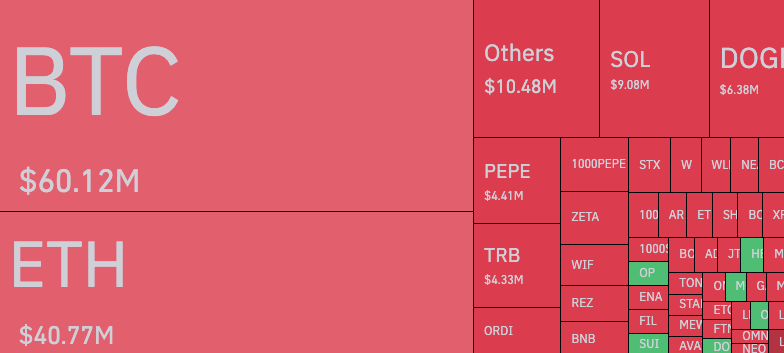
Crypto Liquidations (Source: Coinglass)
But how will prices fare in the coming days? Coin Edition looks at the short-term forecast of BTC and ETH in this article.
Bitcoin (BTC)
On the daily chart, Bitcoin bulls formed support at $57,200, suggesting that the price might not fall below this level in the short term.
However, there was another support at $50,579 with the 20 EMA (blue), confirming the defense. As such, if bears force BTC below the $57,000 region, it could capitulate toward $51,000. But it seems that $50,759 could be the coin’s saving grace.
Furthermore, the 20 EMA and 50 EMA (yellow) were around the same spot, indicating that there was no clear bullish or bearish trend. Should this remain the case in days to come, Bitcoin might swing between $61,328 and $65,881.
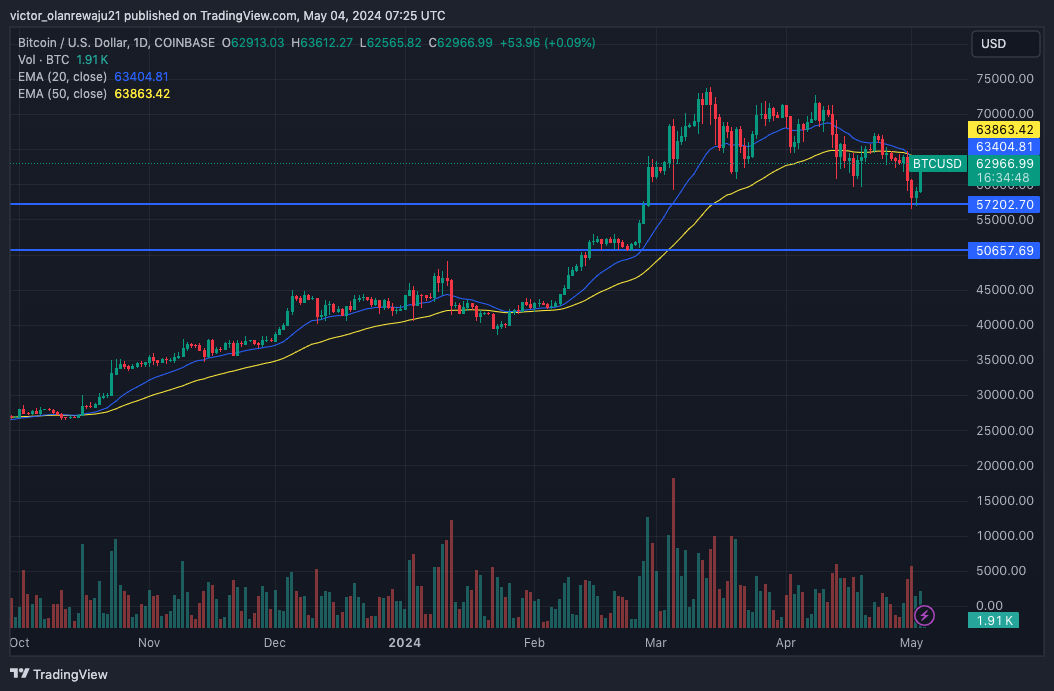
BTC/USD Daily Chart (Source: TradingView)
Ethereum (ETH)
The ETH/USD daily chart indicated market structure struggling to hold on to the bullish side. This inference was also evident from the Relative Strength Index (RSI).
As of this writing, the RSI was below the 50.00 midpoint, indicating that buying momentum was nowhere near solid. As long as the RSI remains below the aforementioned zone, the price risks falling below $3,000.
However, an increase in the indicator could invalidate the bearish bias, and help ETH sustain its place above $3,100. In addition, Coin Edition looked at the Money Flow Index (MFI).
ETH/USD Daily Chart (Source: TradingView)
At press time, the MFI reading dropped, suggesting that ETH was deprived of capital. Therefore, it might be impossible for the price to rally anytime soon. Instead, the altcoin might move sideways or undergo another round of correction.
Disclaimer: The information presented in this article is for informational and educational purposes only. The article does not constitute financial advice or advice of any kind. Coin Edition is not responsible for any losses incurred as a result of the utilization of content, products, or services mentioned. Readers are advised to exercise caution before taking any action related to the company.


