- Bulls might aim for $72,000 if BTC breaches the $70,649 resistance.
- ETH’s momentum was bullish as buyers targeted a move to $3,669.
- SOL’s uptrend could be invalidated while ADA might face the same fate.
The weekend brought relief to the crypto market after participants endured a week mostly full of downsides. Although the respite might not be very significant, it offered balance— something that was rarely seen recently.
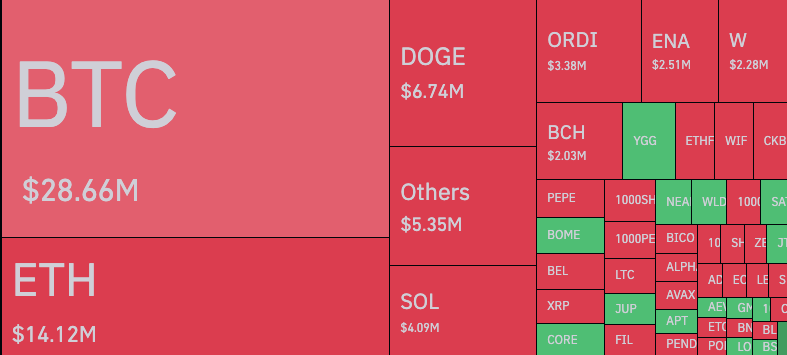
As such, it was not surprising that a large part of the $86.72 million 24-hour liquidations were short positions.
In this piece, Coin Edition looks at the prices of Bitcoin (BTC), Ethereum (ETH), Solana (SOL), and Cardano (ADA), and how they could perform in the short term.
BTC Price Analysis
On April 6, bulls capitalized on the $67,344 support to prevent Bitcoin from going lower. As a result of this formation, the price of BTC crossed $69,000 again. The current trend displayed by the coin signaled that it might try to retest $70,000.
However, an overhead resistance existed at $70,649. If bulls breach this path, Bitcoin’s price might climb to $72,945. On the other hand, rejection might cause the value of the coin to tumble to $65,592.
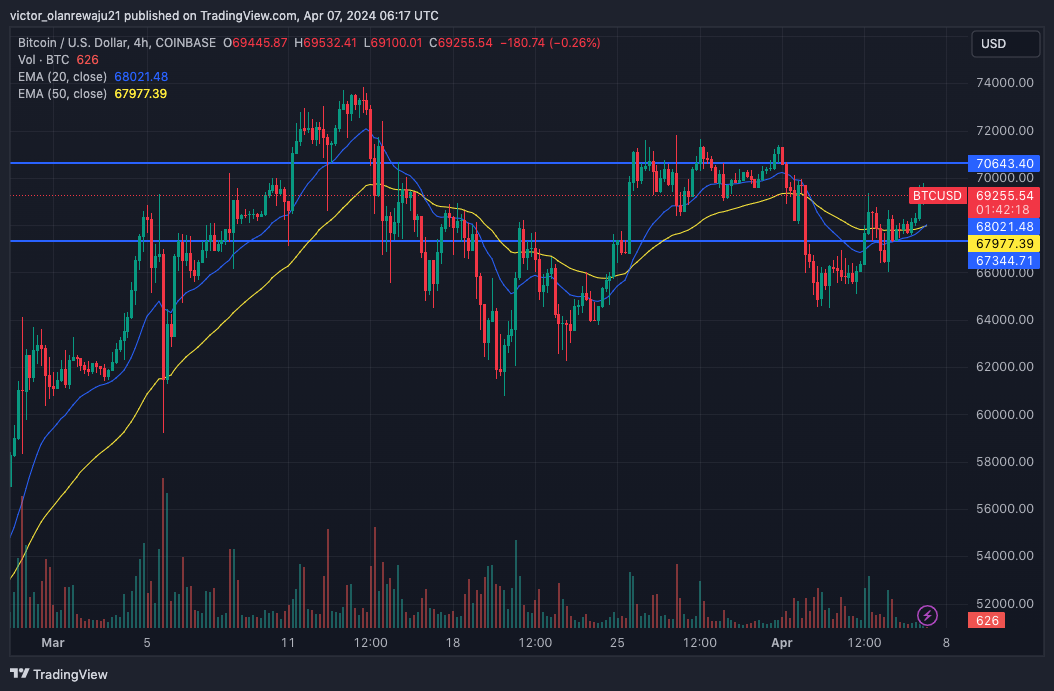
Meanwhile, the 20 EMA (blue) and 50 EMA (yellow) settled below BTC but were close to each other. Should this position hold through the forthcoming days, Bitcoin might swing sideways. In addition, it might not flip its all-time high before the halving.
ETH Price Analysis
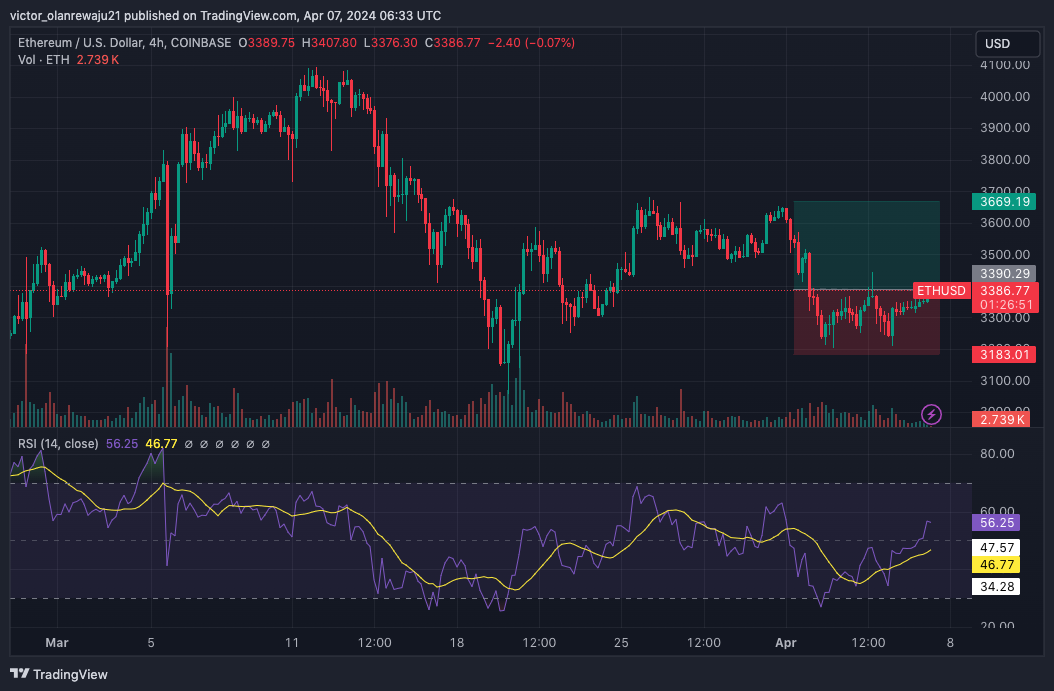
On the 4-hour chart, ETH got closer to $3,390 and shared a similar structure to Bitcoin. According to indications from the Relative Strength Index (RSI), buyers were instrumental to the increase as the reading approached 60.00.
If buying momentum continues to rise, then the price of ETH might hit the $3,500 psychological region. Should ETH climb above this point, the price might increase to $3,669. However, if the attempt is unsuccessful, the value of the altcoin might to $3,238.
SOL Price Analysis
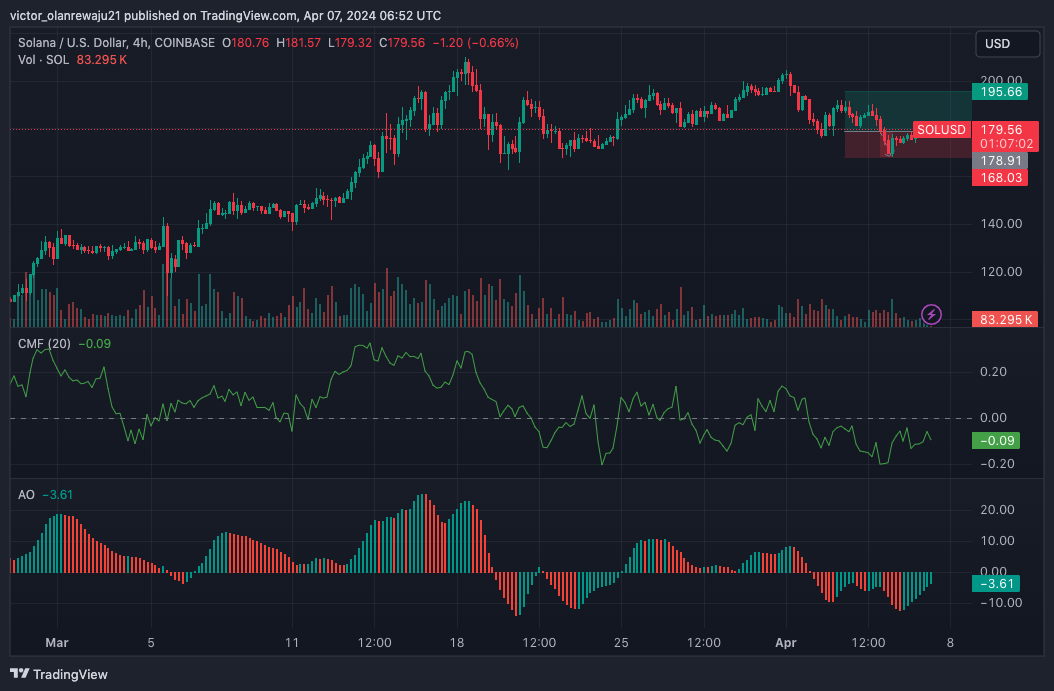
SOL’s price fell below $170 on April 5. But the token had climbed back to $180 as of this writing. Despite the increase, the Chaikin Money Flow (CMF) remained in the negative zone.
Typically, when the CMF drops below zero, it indicates distribution. Hence, this trend implied that SOL upward strength was shaky. Should the CMF remain around the same point, then a pullback might be next for the coin.
Like the CMF, the Awesome Oscillator (AO) was negative too, suggesting increasing downward momentum. However, the AO displayed green histogram bars, indicating that the token could slowly move upwards. Should this be the case, SOL might inch toward $195.66. But if the thesis is invalidated, the value could decline to $168.03.
ADA Price Analysis
According to the 4-hour ADA/USD chart, the 9 EMA (blue) and 20 EMA (yellow) were situated around the same area. A position like this suggests consolidation, with ADA trading around $0.58.
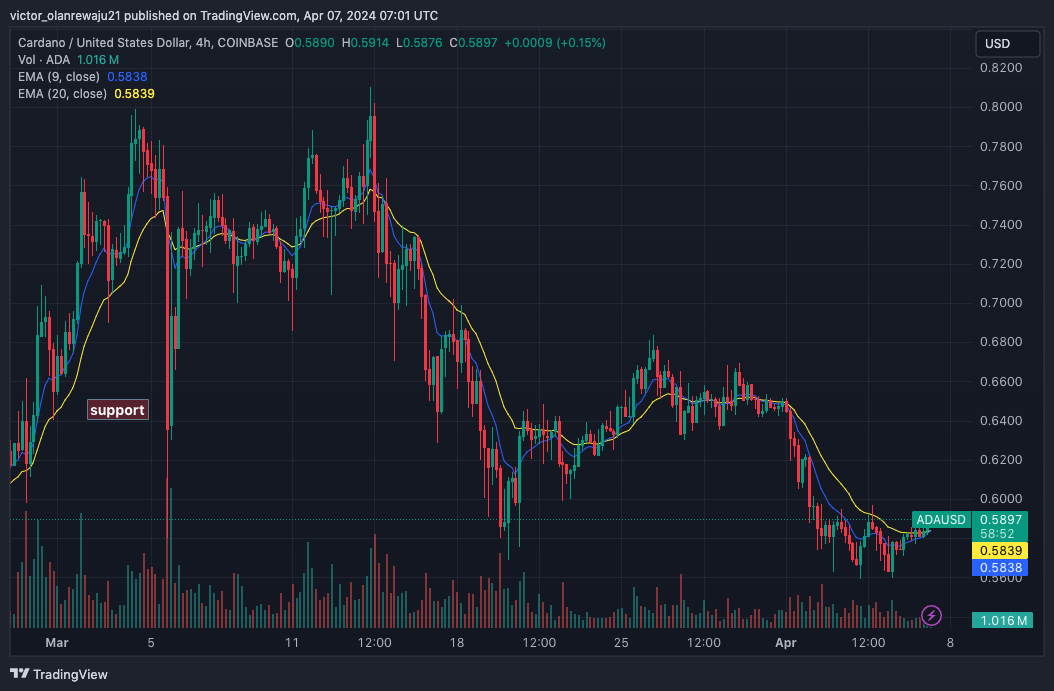
But traders need to watch out. If ADA’s price drops below the short-term EMAs, then the potential recovery could be halted. On the other hand, the price could extend toward $0.62 if the 9 EMA flips the 20 EMA.
Disclaimer: The information presented in this article is for informational and educational purposes only. The article does not constitute financial advice or advice of any kind. Coin Edition is not responsible for any losses incurred as a result of the utilization of content, products, or services mentioned. Readers are advised to exercise caution before taking any action related to the company.


