


- Crypto Analyst tweeted that BTC was forming the “Delayed Bullish Thrust N’ Bust” pattern.
- BTC is testing the 200-day MA after breaking below it. It may not have the momentum to break it.
- The 50-day MA approaches the 200-day MA from above, and BTC could be heading for a death cross.
A crypto influencer and analyst, Tyler Strejilevich, tweeted that a “mega bust” was impending for BTC after it formed the “Delayed Bullish Thrust N’ Bust” pattern with five sequential candlesticks.
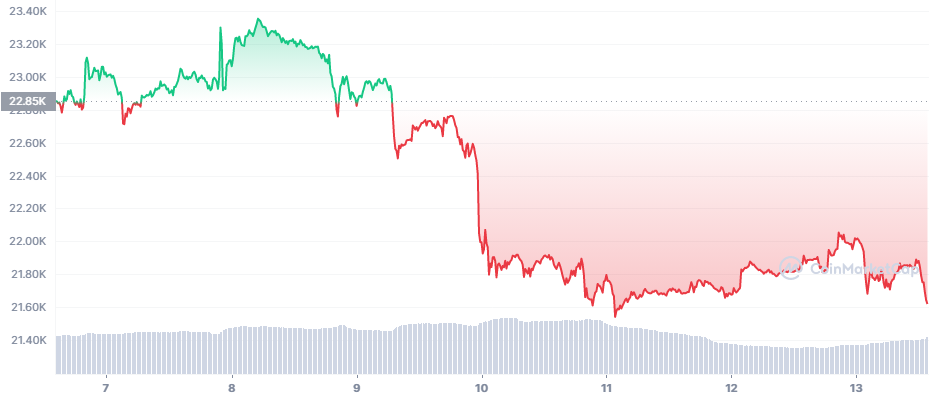
Based on his perspective, the analyst specifically highlights how the “ginormous very bullish candle” was followed by “two decreasingly large green candles,” which then was followed by two bearish candlesticks that go no lower than the second original bullish candle.
Considering the chart below, BTC was trading at an opening market price of $22.88K. It fluctuated with a tight range of $22.7K and $23.40K for the first three days of the week. After a few hours into the third day, the bears pulled BTC down. It fell from $22,986 to $21,781 within a few hours. BTC reaches its lowest price of $21,542 on the fifth day.
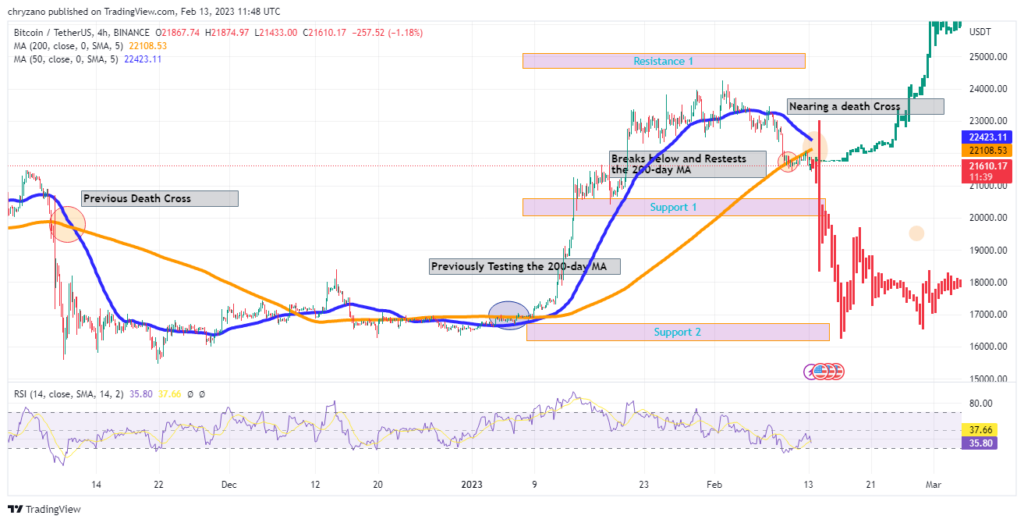
When scrutinizing the chart below, it could be seen that BTC broke below the 200-day MA and is now retesting it. Previously, when BTC tested the 200-day MA, the coin soared above Support. Hence, this pattern could repeat, and BTC could soar above Resistance 1. However, there’s much more than what meets the eye happening with BTC as of present.
Notably, as the 50-day MA is approaching the 200-day MA from above, there is a possibility of a death cross happening in the future. If the death cross is to take place, then based on how BTC behaved in the face of the previous death, it could tank below Support 1 and rebound on Support 2.
Although the Bollinger bands are contracting now, there could be more volatility awaiting BTC on the horizon. Moreover, the spike might take a little longer, while the fall could be imminent.
Hence, intraday traders much watch out for this to make sure that their profit margin is not shrunk.
Moreover, scalpers must watch out and make timely decisions in order to avoid losses. And those holding a long position could only hope and pray that the death cross does not happen. This is because once the death cross happens, BTC consolidates for a long time before it gets the momentum from the bulls to increase significantly.
Disclaimer: The views and opinions, as well as all the information shared in this price analysis, are published in good faith. Readers must do their own research and due diligence. Any action taken by the reader is strictly at their own risk, Coin Edition and its affiliates will not be held liable for any direct or indirect damage or loss.
Disclaimer: The information presented in this article is for informational and educational purposes only. The article does not constitute financial advice or advice of any kind. Coin Edition is not responsible for any losses incurred as a result of the utilization of content, products, or services mentioned. Readers are advised to exercise caution before taking any action related to the company.


