


- PlanB questioned in a tweet today whether the BTC halving trading strategy will be effective again.
- At press time, BTC was trading at $30,650.72 after it gained 0.40% over the past 24 hours.
- A medium-term bearish chart pattern was forming on BTC’s daily chart which may lead to a price drop.
The crypto analyst PlanB questioned in a tweet whether purchasing Bitcoin (BTC) six months before the halving and selling BTC 18 months after the halving will prove to be an effective strategy. This trading approach has historically generated better returns than a simple buy-and-hold strategy, according to the analyst.
At press time, CoinMarketCap indicated that BTC was changing hands at $30,650.72 after it gained 0.40% over the past 24 hours. This positive daily performance added to BTC’s positive weekly performance, pushing the total weekly gain to 1.03%.
BTC’s trading volume also saw an increase in the past 24 hours. As a result, the crypto’s 24-hour trading volume stood at $11,899,592,802, which was a 47.65% increase in the total volume.
In addition, BTC was able to make its way onto CoinMarketCap’s trending list, and occupied the number 2 position. This ranked it behind the popular meme coin Pepe (PEPE) and ahead of Litecoin (LTC) at press time.
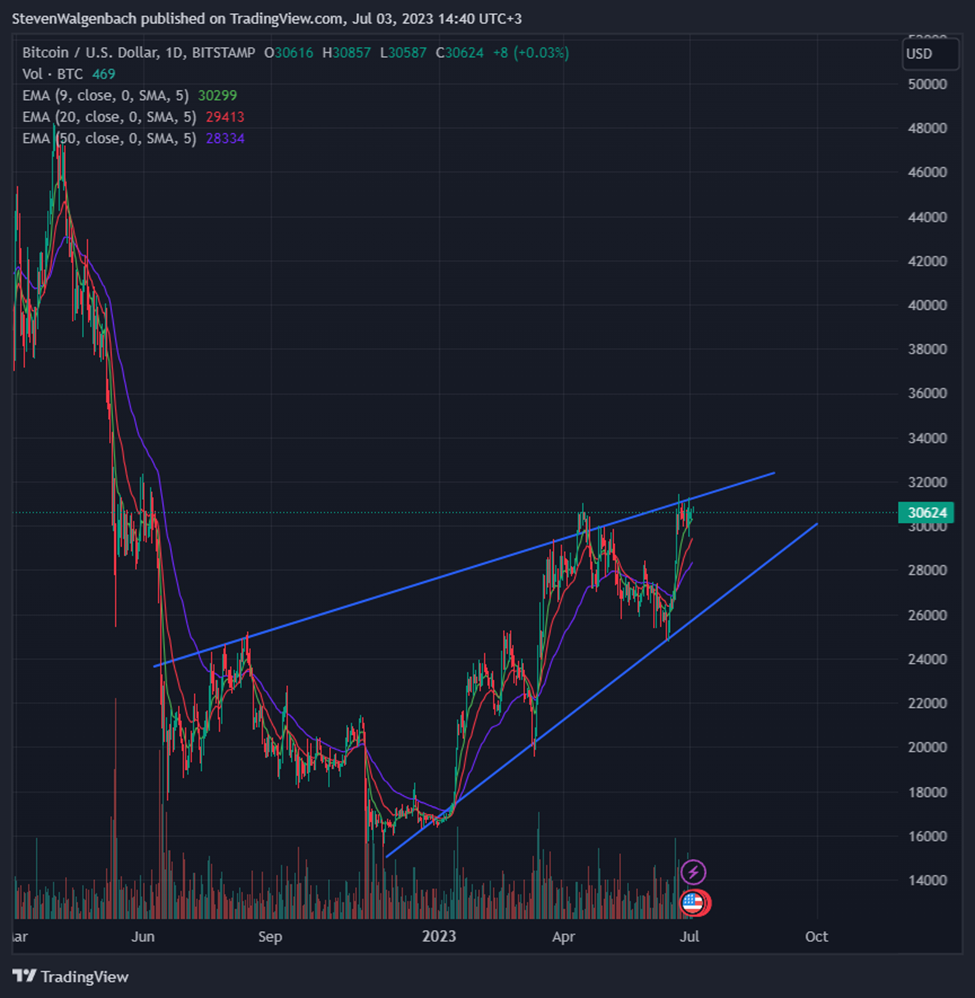
BTC had the support of the 9-day EMA line at press time. Furthermore, the 9-day EMA line was positioned above the 20-day EMA line. This suggested that BTC was in a short-term bullish cycle and the crypto’s price would continue to rise in the next 24-48 hours.
Despite the bullishness expressed by the 9-day and 20-day EMA lines, a medium-term ascending wedge chart pattern was forming on BTC’s daily chart. This was a bearish chart pattern that, if validated, could result in BTC’s trend reversing from bullish to bearish.
BTC’s price may continue to rise in the coming 2 weeks as it approaches the apex of the chart pattern. On the other hand, BTC’s price could also decline in the next week given that it is trading near the upper level of the bearish chart pattern. In this scenario, BTC’s price may drop below the 50-day EMA line towards the lower level of the chart pattern at around $27,620.
Disclaimer: The views and opinions, as well as all the information shared in this price analysis, are published in good faith. Readers must do their own research and due diligence. Any action taken by the reader is strictly at their own risk. Coin Edition and its affiliates will not be held liable for any direct or indirect damage or loss.
Disclaimer: The information presented in this article is for informational and educational purposes only. The article does not constitute financial advice or advice of any kind. Coin Edition is not responsible for any losses incurred as a result of the utilization of content, products, or services mentioned. Readers are advised to exercise caution before taking any action related to the company.


