


- Bitcoin price rises due to FOMC statement anxiety.
- BTC has been on an upward trend in the preceding 24 hours, according to recent statistics
- Technical signs indicate that a prolonged bull run is on the horizon.
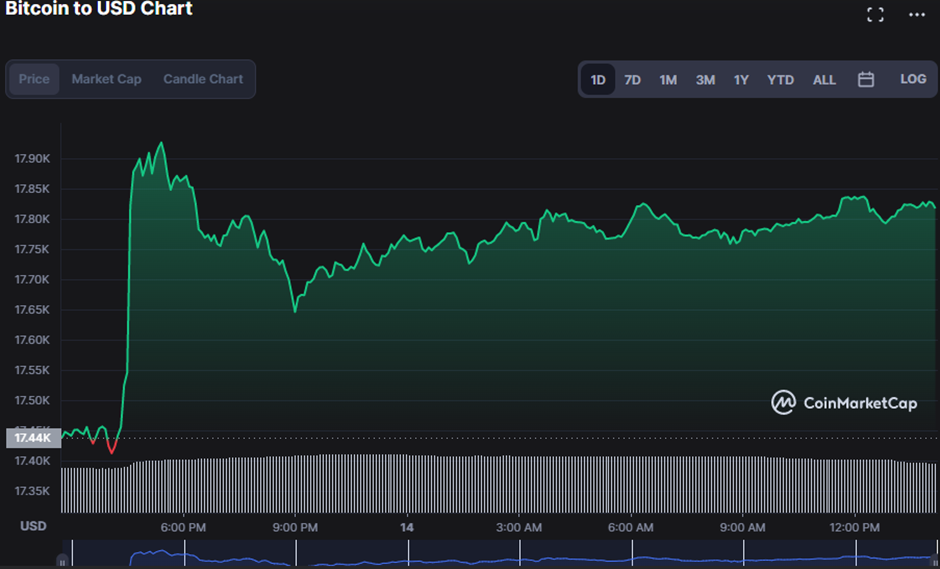
The bulls remained in charge of the market throughout the day after invalidating the short-lived momentum that had succeeded in pushing prices to $17,412.19. As of press time, this upward momentum has managed to value Bitcoin (BTC) prices at $17,888.92, representing a 2.51% boost.
With the anticipated interest rate hike, the BTC market has seen increased purchasing pressure, with trading volume increasing by 9.77% to $22,941,703,396 and market capitalization increasing by 2.20% to $342,843,373,129. This move bolsters the BTC market’s tenacity as well as the much-anticipated Federal Open Market Committee (FOMC) announcement.
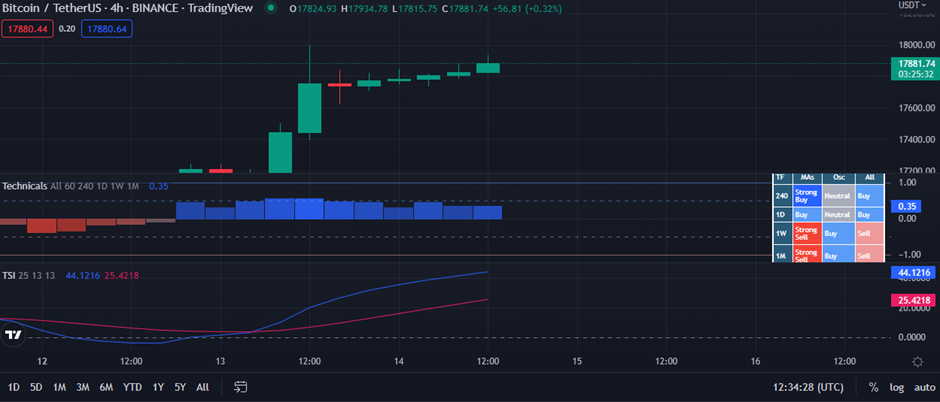
The Technical Rating indicator suggests that the purchasing pressure in the TRX market is building, highlighting a long position order, because a “strong buy” signal with a rating of 0.35 appears on the 4-hour price chart.
The True Strength Index achieves a bullish crossover on the price chart with a value of 43.9298, crossing the signal line in the positive area. If TRX bulls do not exhaust themselves in the short term, this movement indicates a continuing bullish run.
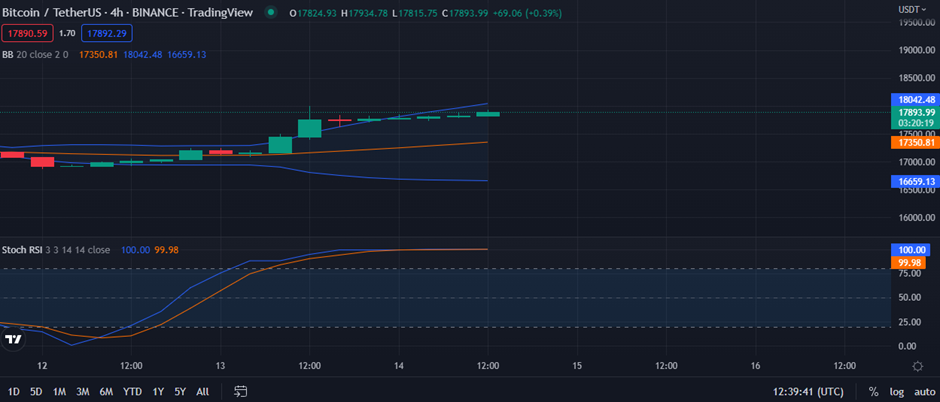
Rising Bollinger Bands and widening bands represent the progress of a bull market, as shown in the BTC price chart, where the upper band now sits at $18042.29 and the lower band sits at $16658.84. The fact that prices have been creeping up toward the top band is another hint that the present market trend may continue.
With a Stoch RSI of 100.00, the BTC market is in the overbought zone, signaling the conclusion of the recent bullish run. However, this does not guarantee a price drop and rather advises investors to be vigilant.
If the bulls can hold the resistance level, the King coin might see even more euphoric supremacy.
Disclaimer: The views and opinions, as well as all the information shared in this price analysis, are published in good faith. Readers must do their own research and due diligence. Any action taken by the reader is strictly at their own risk, Coin Edition and its affiliates will not be held liable for any direct or indirect damage or loss.
Disclaimer: The information presented in this article is for informational and educational purposes only. The article does not constitute financial advice or advice of any kind. Coin Edition is not responsible for any losses incurred as a result of the utilization of content, products, or services mentioned. Readers are advised to exercise caution before taking any action related to the company.


