

- Bitcoin trades near $66,655 after clearing the $65,711 resistance level during a volatile session.
- CryptoQuant data shows exchange reserves near 2.7 million BTC as available trading supply continues to decline.
- One analyst reported a 13,762 BTC exchange inflow, creating short-term selling risk after the breakout.
Bitcoin’s move above $65,711 has placed the latest rally between two opposing on-chain signals. Exchange reserves continue falling, yet a large exchange inflow has raised short-term distribution risk. Price remains above former resistance, but the supporting data does not point in one direction.
Notably, BTC later traded near $66,655 after ranging between $64,772 and $66,872. Meanwhile, wider Middle East tensions added another source of volatility as the Houthis declared a blockade against Saudi shipping. Maritime risks now cover both Gulf and Red Sea routes.
Bitcoin Breakout Meets Geopolitical Pressure
GugaOnChain recorded Bitcoin near $66,368 when the asset cleared $65,711 resistance. His analysis placed the Keynes liquidity preference metric at 4.73%. That reading remained above the post’s stated exhaustion threshold, below 4%.
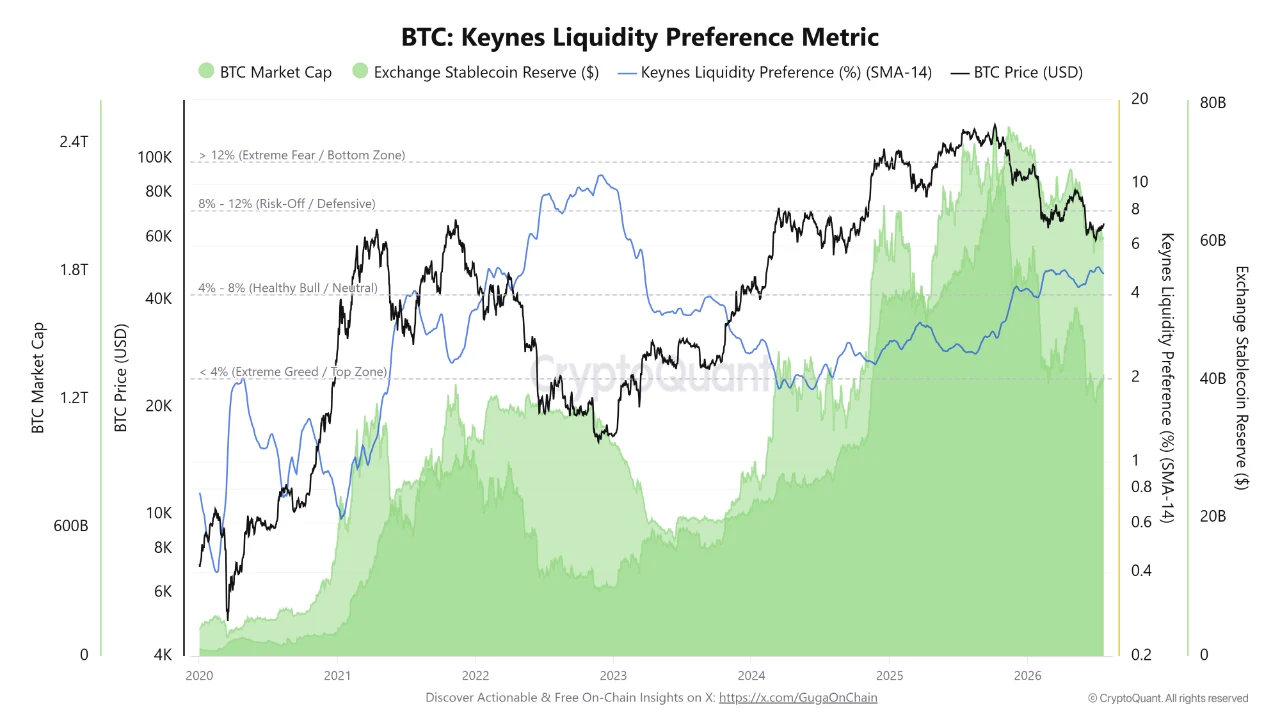
GugaOnChain also reported a 13,762 BTC exchange inflow during early Asian trading. He said the breakout lacked clear institutional volume. His assessment linked the transfer increase to possible distribution near an overbought technical area.
Regional risk developed at the same time. Yemen’s Houthis announced a naval blockade against Saudi Arabia around the Bab el-Mandeb route. Reuters reported that the move widened risks for energy supplies and international trade.
Falling Reserves Reduce Available Supply
On one hand, Zakariya Sharif focused on a longer-term decline in centralized exchange balances. His chart showed combined reserves near 2.7 million BTC while Bitcoin traded near $66,809. Reserve levels have moved lower from previous market-cycle highs.
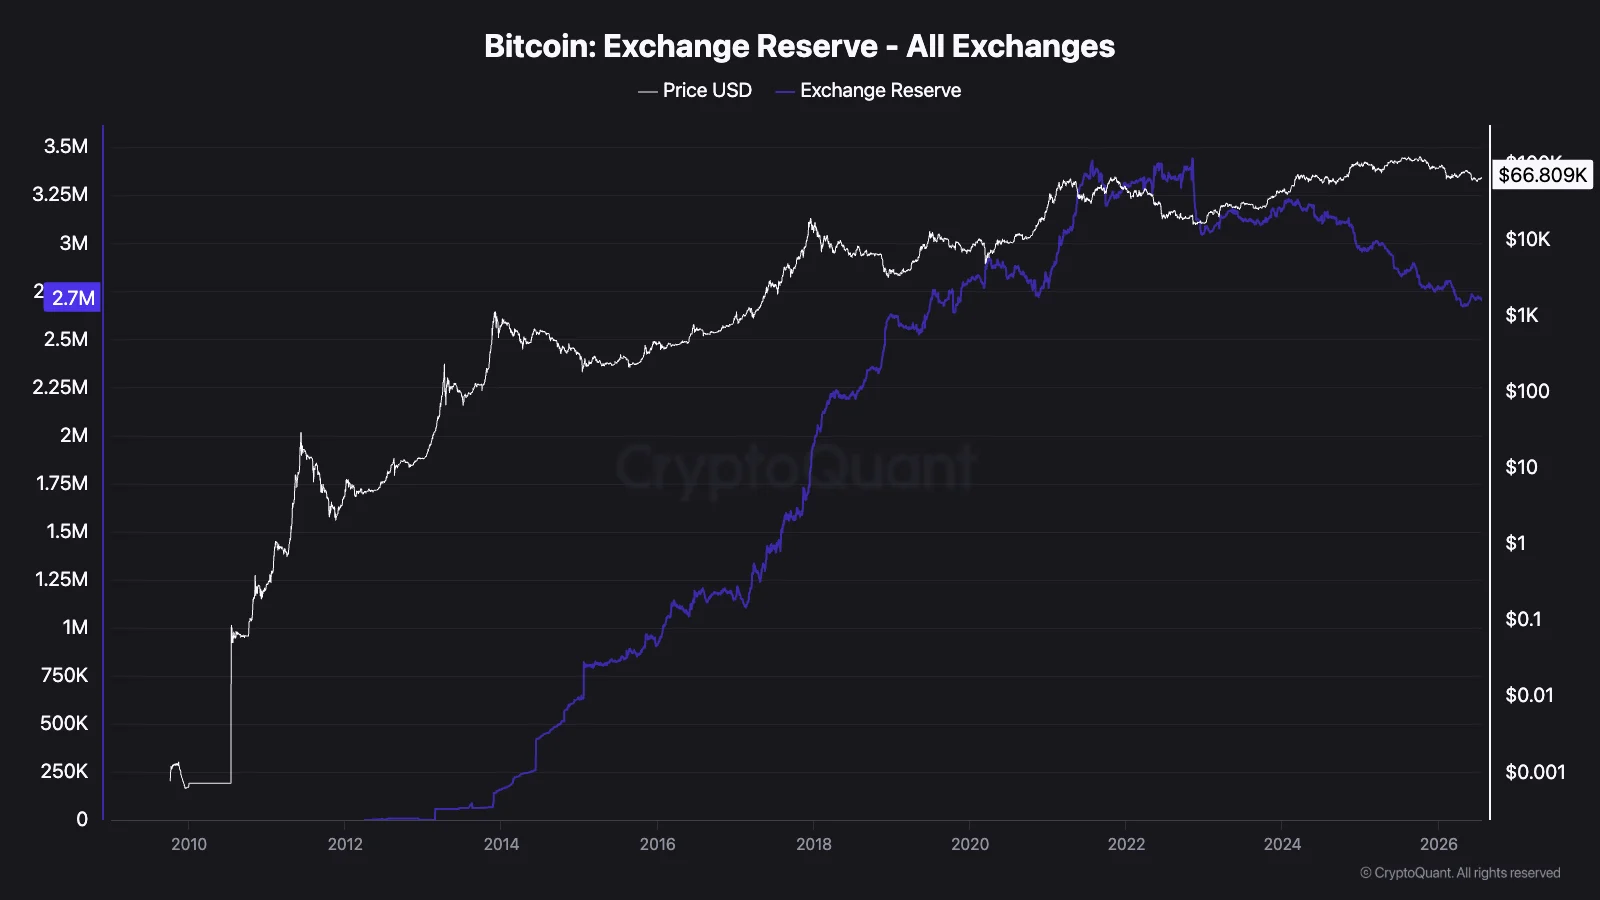
Exchange reserves measure Bitcoin held in exchange-controlled addresses. Falling balances show fewer coins sitting directly on trading platforms. However, withdrawals can reflect private custody, long-term storage, institutional transfers, or other movements.
Consequently, lower reserves may reduce immediately available supply during periods of steady demand. Nevertheless, that reading does not cancel shorter inflow spikes, including the 13,762 BTC movement reported by GugaOnChain.
Related: XRP Price Approaches $1.13 Breakout as Analysts Track Higher Targets
Fund Flow Ratio Shows Lower Exchange Activity
On the other hand,CryptoQuant’s Fund Flow Ratio chart displayed a reading near 0.068. This metric divides total Bitcoin exchange inflows and outflows by all Bitcoin transferred across the network.
A lower ratio shows that exchanges account for a smaller share of network transfers. It does not identify whether the remaining activity comes from buyers, sellers, institutions, or retail users.
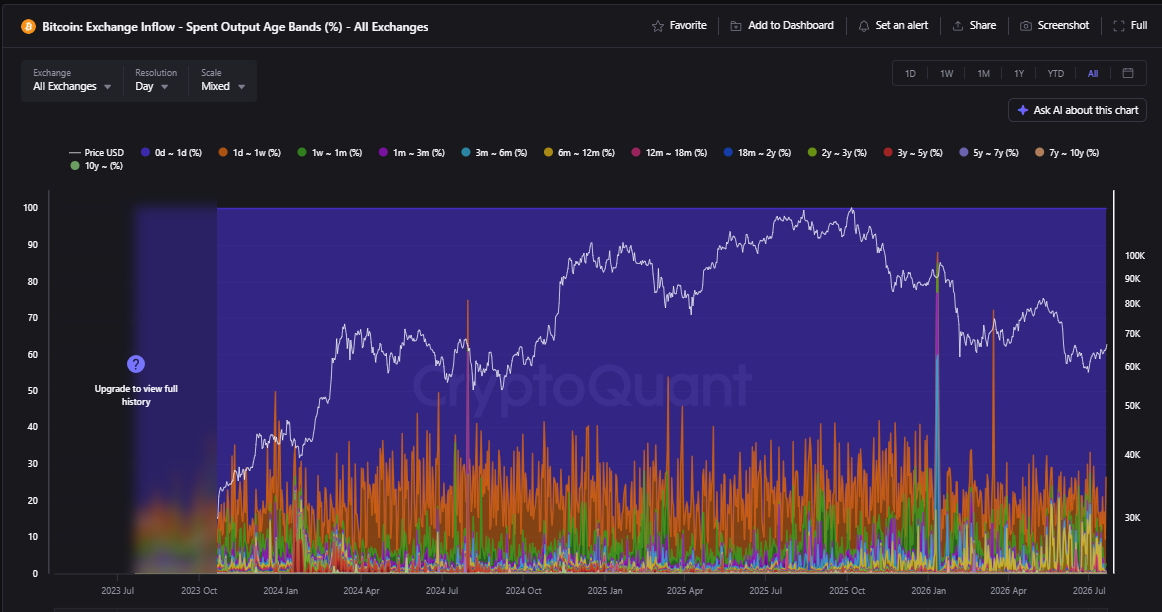
Meanwhile, the Exchange Inflow Spent Output Age Bands chart shows activity across several coin age groups. Recent inflows appear dispersed rather than concentrated in one continuous holder cohort. Each band tracks coins by the period since their previous movement.
Bitcoin remains above $65,711, while the current intraday range places nearby resistance around $66,872. Falling reserves support a tighter supply structure, while large exchange deposits keep short-term selling pressure under observation.
Disclaimer: The information presented in this article is for informational and educational purposes only. The article does not constitute financial advice or advice of any kind. Coin Edition is not responsible for any losses incurred as a result of the utilization of content, products, or services mentioned. Readers are advised to exercise caution before taking any action related to the company.