


- Fantom (FTM) is under bullish control despite resistance at $0.4203.
- The Keltner Channel bands are moving linearly, indicating a period of market consolidation.
- The bullish momentum in FTM may fade as the Rate of Change (ROC) falls.
Fantom (FTM) has been under bullish control in the last day, with a bearish effort to grab control thwarted when support was established at $0.4083.
The bullish rise, however, ran into resistance around the 24-hour high of $0.4203. Despite the resistance, bullish dominance was still present, as evidenced by the 0.76% increase to $0.4127 as of press time.
During the rise, the market capitalization increased by 0.66% to $1,150,480,606, but the 24-hour trading volume decreased by 5.42% to $86,391,567. This disparity may indicate a slowdown in market activity as investors become less active even as the market cap rises.
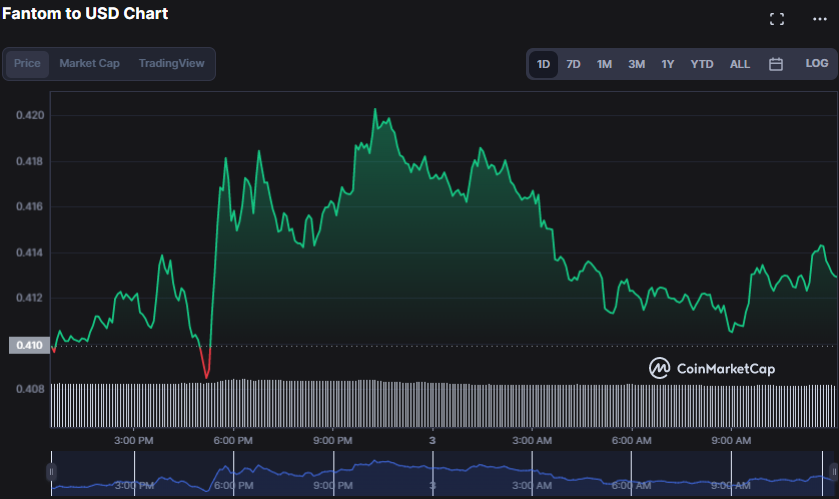
FTM/USD 24-hour price chart (source: CoinMarketCap)
The Keltner Channel bands are moving linearly on the 1-hour FTMUSD price chart, indicating a period of market consolidation in which neither bulls nor bears have a clear edge. The top, middle, and bottom bars all read $0.4194, $0.4136, and $0.4079, respectively, indicating this shift.
The price action’s movement generates red candlesticks below the middle band, indicating that the bears seek to drive the price down. Nonetheless, the lack of a strong breakout suggests that the bulls are fighting back and preventing a significant price drop.
The bullish momentum in FTM may fade now that the Relative Strength Index has fallen below its signal line at 46.65. However, it is not yet cause for concern because the RSI is still above the oversold level of 30, indicating that the bulls have room to regain control.
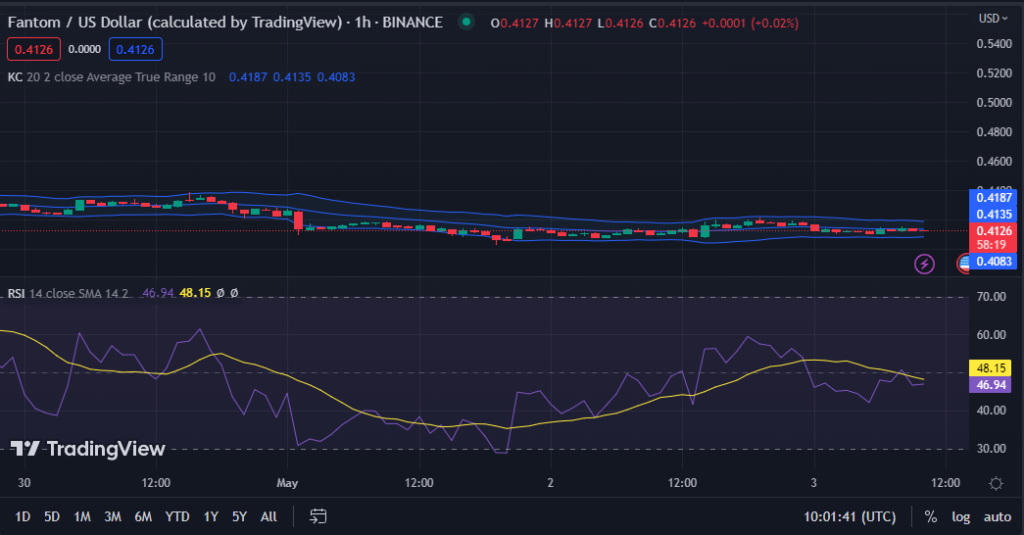
FTM/USD chart (source: TradingView)
The latest Rate of Change (ROC) plunge below the “0” line with a reading of -0.19 indicates that the bullish momentum in FTM is fading, and a probable shift to negative momentum is on the horizon.
If the ROC continues to fall and crosses below -0.5, it may imply a greater negative trend and alert traders to consider selling their holdings.
Despite being bullish, the technical rating indicator displays a “strong sell,” warning traders to place stop-loss orders to limit potential losses if the trend continues to deteriorate.
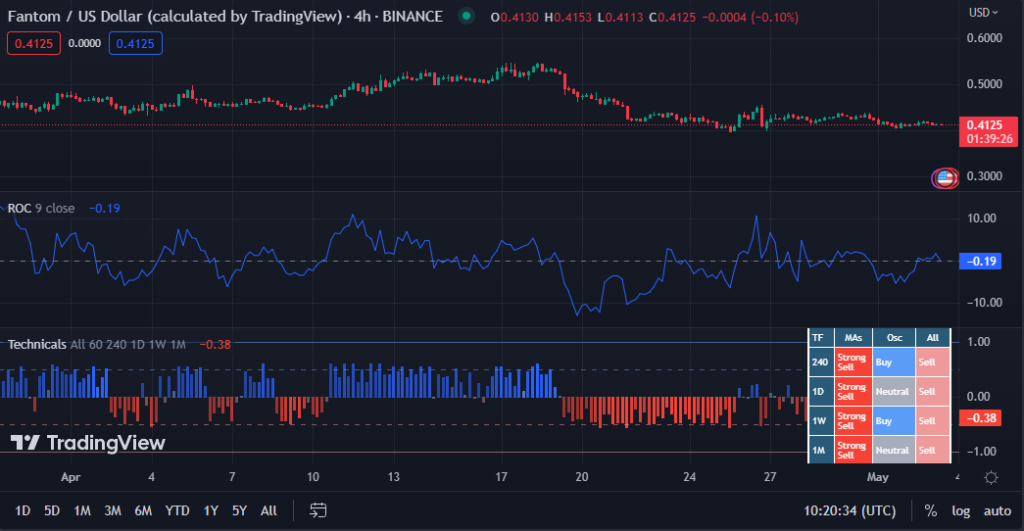
FTM/USD chart (source: TradingView)
In conclusion, while FTM’s bullish momentum may be fading, investors should closely monitor the ROC and RSI for any potential shifts in market sentiment.
Disclaimer: The views, opinions, and information shared in this price prediction are published in good faith. Readers must do their research and due diligence. Any action taken by the reader is strictly at their own risk. Coin Edition and its affiliates will not be liable for direct or indirect damage or loss.
Disclaimer: The information presented in this article is for informational and educational purposes only. The article does not constitute financial advice or advice of any kind. Coin Edition is not responsible for any losses incurred as a result of the utilization of content, products, or services mentioned. Readers are advised to exercise caution before taking any action related to the company.


