


- Bullish momentum fades as prices decline once more.
- Prices on the DOT drop by 0.59%.
- Technical signs suggest that this trend might persist.
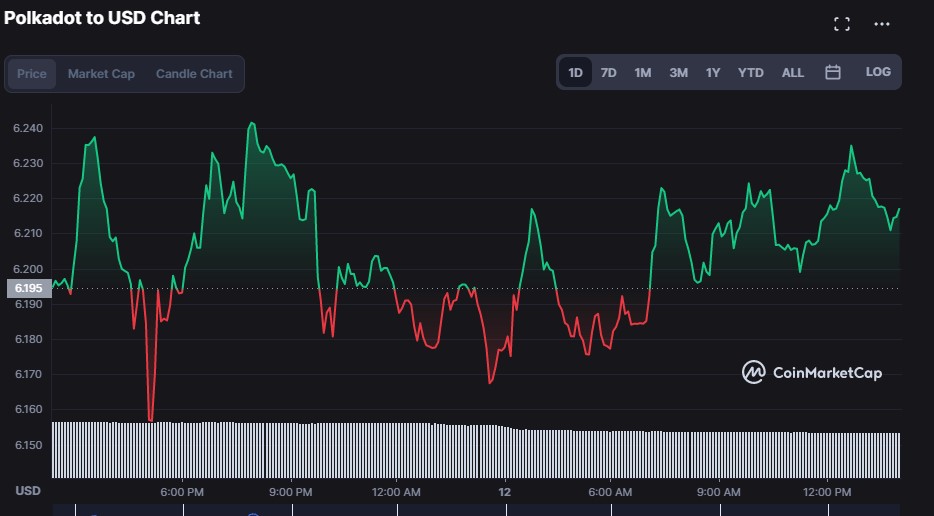
The Polkadot price analysis of the daily price chart shows that the digital asset was clearly rising in recent hours but has since fallen sharply. At the time of writing, the value of DOT was $6.19 and it was trading down 0.59% versus the US dollar. The bullish impetus that was visible was transient.
DOT’s market capitalization is $6,992,651,071, up 0.85% from the preceding day, and its trading volume is $151,949,673, down 18.67%.
According to the technical indicators on the hourly ,4-hour and daily charts ,bulls have taken control of the market which are all pointing toward an uptrend.
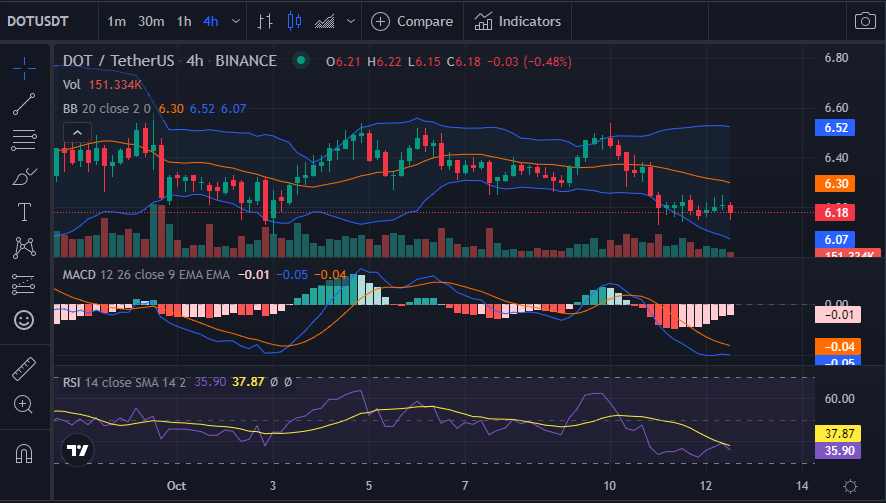
The market has stabilized and is currently trading in a constrained range after a sharp rally, and the Bollinger Bands are bulging as a result. The market, however, appears to be moving in the direction of the lower band, according to the 4-hour price chart. A movement in the direction of the lower band denotes bearish momentum. At 6.52 and 6.07, respectively, the upper and lower bands touch. These levels act as the prices’ immediate support and resistance.
The blue MACD line has crossed below the signal line and is currently going toward the negative area with a value of -0.05. As of the time of writing, this shows a selling pressure in the current market, which suggests a bearish trend in the near future. Additionally, the histogram is in the negative region, indicating a recent acceleration in the falling trend. The Relative Strength Index (RSI), which recently reached 34.96, has an increasing gradient which is approaching the edge of the oversold boundary, 30 indicates that there is still room for the cryptocurrency to continue with this trend, a leveling of the buying and selling forces. This demonstrates the stability of the market. However, price activity at the center area may move in any way.
A bearish crossing, which happens when a short-term moving average crosses below a longer-term moving average, verifies a downward momentum, as can be seen in the DOT price chart. The 20-day MA hits at 6.30 while the 50-day MA touches at 6.35, demonstrating a downward tendency as compared to the 50-day MA. The stochastic RSI likewise exhibits a downward trend, reading 29.22 and heading in the direction of the oversold zone of 20.
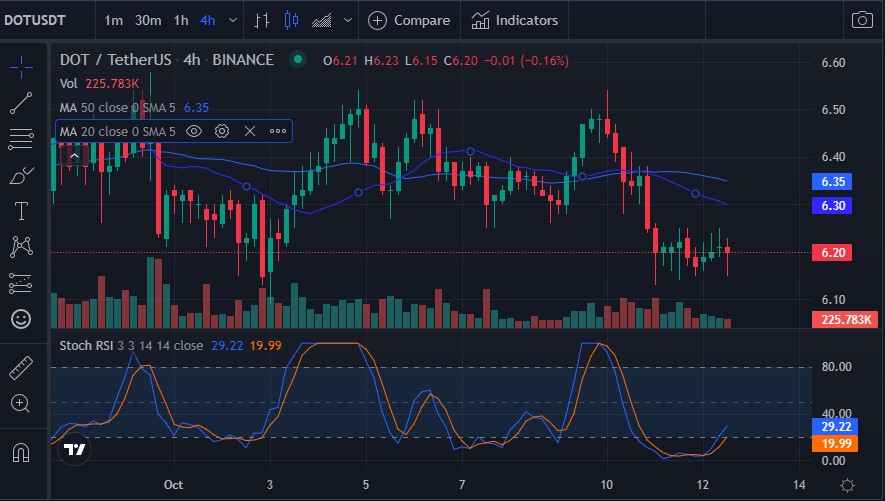
Overall, the bulls must raise prices in order to render the descending channel invalid in order to reverse the current trend.
Disclaimer: The views and opinions, as well as all the information shared in this price prediction, are published in good faith. Readers must do their research and due diligence. Any action taken by the reader is strictly at their own risk. Coin Edition and its affiliates will not be held liable for any direct or indirect damage or loss.
Disclaimer: The information presented in this article is for informational and educational purposes only. The article does not constitute financial advice or advice of any kind. Coin Edition is not responsible for any losses incurred as a result of the utilization of content, products, or services mentioned. Readers are advised to exercise caution before taking any action related to the company.
: What Happens If You Use an Unlicensed Platform?")


