


- Shiba Inu tanked to its previous low of July 12 at 0.0000098.
- SHIB might speculatively rebound from here.
- There are signs of bullish divergence on the 4-hour chart.
Shiba Inu price analysis indicates the possibility of a corrective rally in the near term. SHIB reached its previous low on July 12th at $0.0000098 and by the 14th of August, it had surged by 100% to $0.0000179.
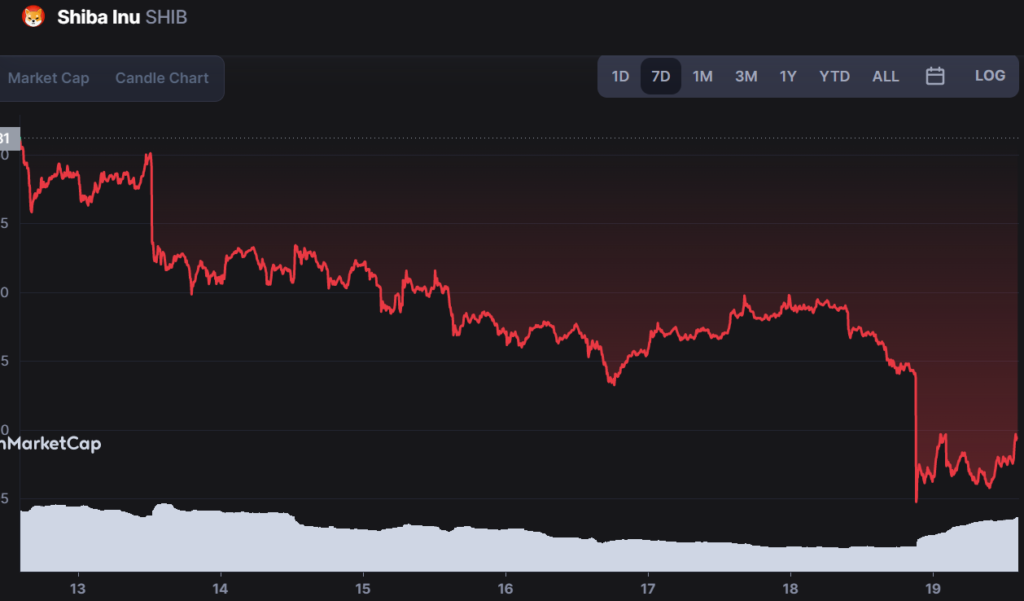
Shiba Inu is trading at $0.00001094 at the time of writing, down by over 6% in the last 24 hours. The intra-day low for the SHIB/USD pair is at $0.00001036 while the high is at $0.00001171. A lot of major digital assets are presently nursing heavy losses in the range of 5% to 20%.
The digital currency declined from highs of $0.0000131 and has been on a continuous downtrend to lows of $0.0000105. The token is presently fluctuating between $0.000011 and $0.0000105.
Currently, the Relative Strength Index (RSI) for the SHIB/USD pair is at 44.83, and it appears the bulls might have some short-term respite as the RSI diverges from the price.
The Moving Average Convergence Divergence (MACD) for the SHIB/USD pair is presently in the bearish zone as the signal line (blue) diverges below the histogram.
Meanwhile, the moving averages are presently bearishly placed as the 50 Simple Moving Average (SMA) diverges below the 200 SMA on the 4-hour chart.
The 24-hour trading volume for the token is $412,002,343.57 while the market capitalization is at $6.0 billion, making it the 14th largest digital asset. The trading volume has increased by 117.40% while the market capitalization has declined by 6.59% in the last 24 hours.
Recent market activity has seen a lot of investors selling their digital assets to take profits following the massive selling action in the broader market. The bulls are anticipated to be targeting gains above $0.0000131 while the bears will be aiming for losses below $0.0000105 in the near term. SHIB might rebound speculatively from here as clear green candlesticks are being formed on the 4-hour price chart. The token might correct higher in the near term as the bulls look to take control of the market.
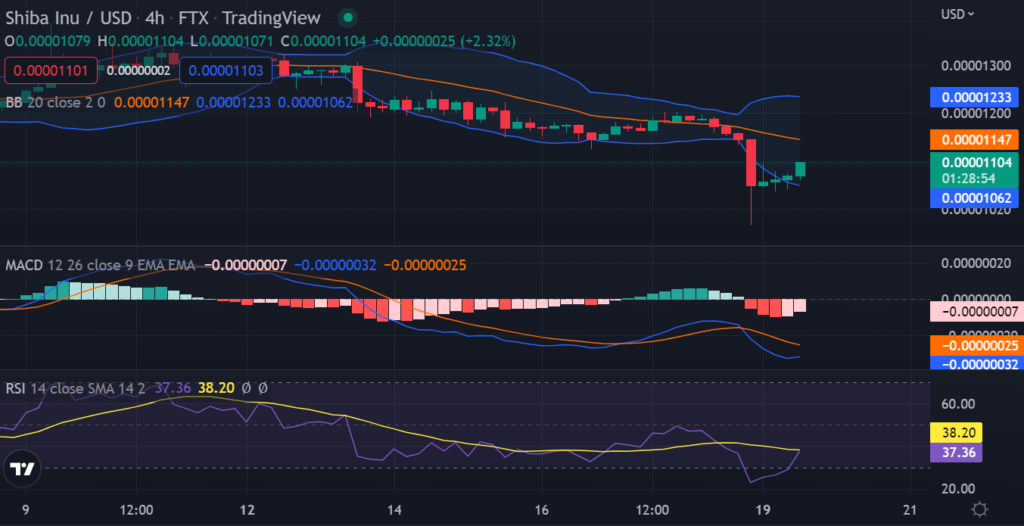
The Bollinger bands are expanding, which indicates increased volatility in the market. The prices might break out of the $0.0000131 resistance level to resume the uptrend.
The digital currency is presently facing stiff resistance at $0.0000115 as bulls attempt to push prices higher. A break above this resistance level could see the SHIB price target the $0.0000131 highs.
On the other hand, if the digital currency corrects lower, immediate support is seen at $0.0000105. A break below this level could see the digital currency target the $0.0000098 lows.
In a nutshell, Shiba Inu price analysis indicates the possibility of a corrective rally in the near term as the token tests its previous lows. The RSI diverges from the price, and this might offer some respite for the bulls.
Disclaimer: The information presented in this article is for informational and educational purposes only. The article does not constitute financial advice or advice of any kind. Coin Edition is not responsible for any losses incurred as a result of the utilization of content, products, or services mentioned. Readers are advised to exercise caution before taking any action related to the company.


