


- Cardano price analysis shows a bullish trend today.
- The nearest resistance is present at $0.3314.
- The nearest support for ADA is present at $0.32.
Recent Cardano price analysis shows that the currency has experienced a bullish recovery over the last 24 hours, with its value reaching $0.3286 and gaining a 0.30% increase. The nearest resistance for ADA is present at $0.3314, and the currency appears to be gaining momentum heading into the near future. Support is also present at $0.32, which could help to provide some stability to ADA if the price begins to decline.
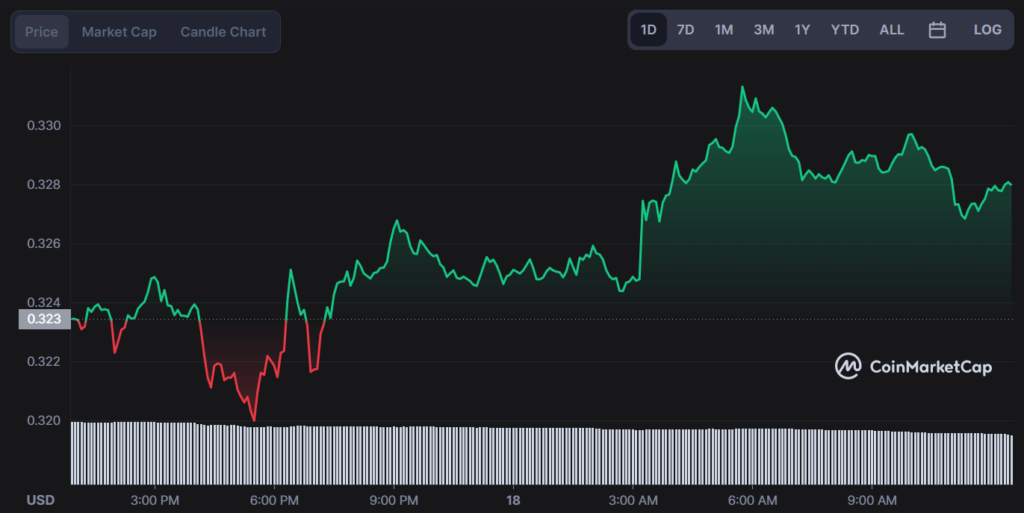
The 24-hour trading volume for Cardano also shows a strong uptick to $170 million, and a market cap of $7.6 billion. In the past 24 hours, the bears and the bulls have both been active in the market, with a series of price swings occurring between these two forces. However, based on the current momentum and strong support levels at $0.32, it seems likely that Cardano will continue to see gains over the coming hours.
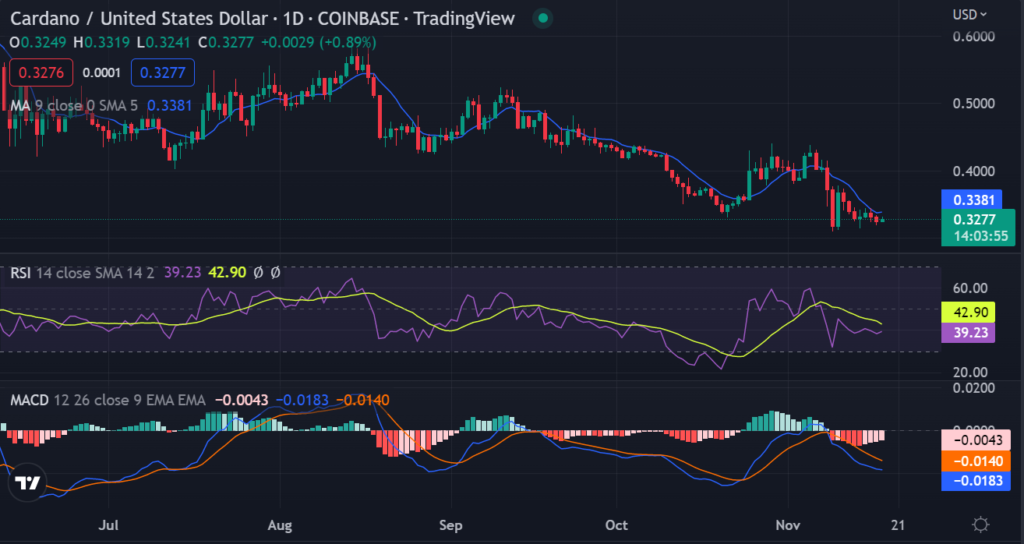
The ADA/USD price travels over the moving average curve indicating that the market is on a bullish trend. Cardano price analysis reveals that the Relative Strength Index (RSI) score is 43.19, making the cryptocurrency enter the inflation region. Furthermore, the RSI score moves upwards, indicating the buying activity exceeds the selling activity while moving toward overvaluation. The Histogram on the MACD indicator is increasing showing that the bears and bulls are fighting to take over the ADA market.
Looking at the hourly price trend of ADA/USD, we see that the market recently broke out from an ascending triangle pattern. The bears are still trying to push the bulls back, but the bulls are fighting back by buying at support levels. As long as the price stays above $0.32, we can expect ADA to continue its bullish trend and see further gains in the coming days.
The price has traveled above its moving average (MA), which indicates that a bullish trend is prevailing. The RSI indicator evidences the buying activity in the market, which indicates an overvalued market. However, ADA price analysis also reveals that further gains are expected as long as the cryptocurrency remains above the $0.32 support level. The MACD is also showing bullish signals, as the signal line and the MACD line are moving closer to each other.
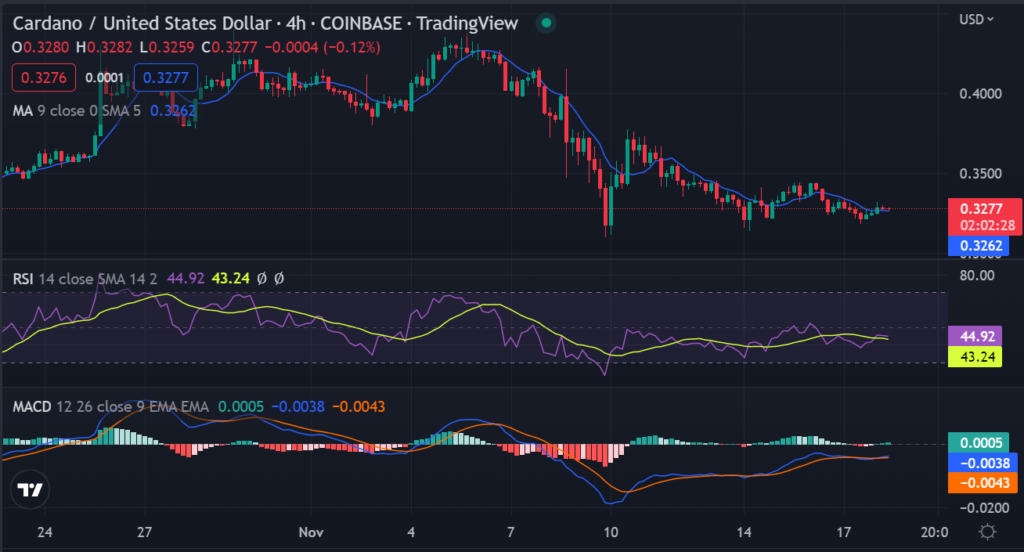
Overall, Cardano price analysis depicts that the crypto gained momentum over the past 24 hours, but on 4-hour and 1-hour timeframes, we see that the market is trying to follow a bearish trend. However, it appears likely that ADA will continue to see battles between the bulls and the bears in the near future.
Disclaimer: The views and opinions, as well as all the information shared in this price analysis, are published in good faith. Readers must do their own research and due diligence. Any action taken by the reader is strictly at their own risk. Coin Edition and its affiliates will not be held liable for any direct or indirect damage or loss.
Disclaimer: The information presented in this article is for informational and educational purposes only. The article does not constitute financial advice or advice of any kind. Coin Edition is not responsible for any losses incurred as a result of the utilization of content, products, or services mentioned. Readers are advised to exercise caution before taking any action related to the company.
 Price Prediction 2026, 2027, 2028, 2029, 2030 -2050")


