


 Intervene; Will the Price Surge?")
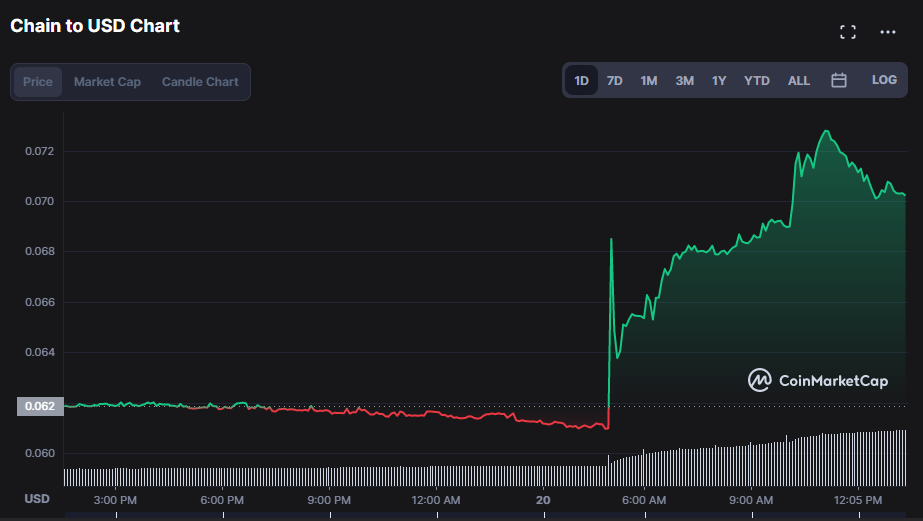
- On the previous day, $0.06094 served as support for XCN and$0.07293 served as resistance.
- Over the previous 24 hours, XCN price increased by over 9.70%.
- A strong positive market sentiment is evident through Chain Price Analysis.
The Chain (XCN) 1-day price chart shows perfect bullish momentum with room for additional strong movements after finding support at $0.06094.
XCN is up 9.70% and trading at $0.06781 as of press time.
The market capitalization increased by 13.73% to $1,500,933,915, and the trading volume increased by 238.79% to $42,626,834 to achieve this favorable price movement.
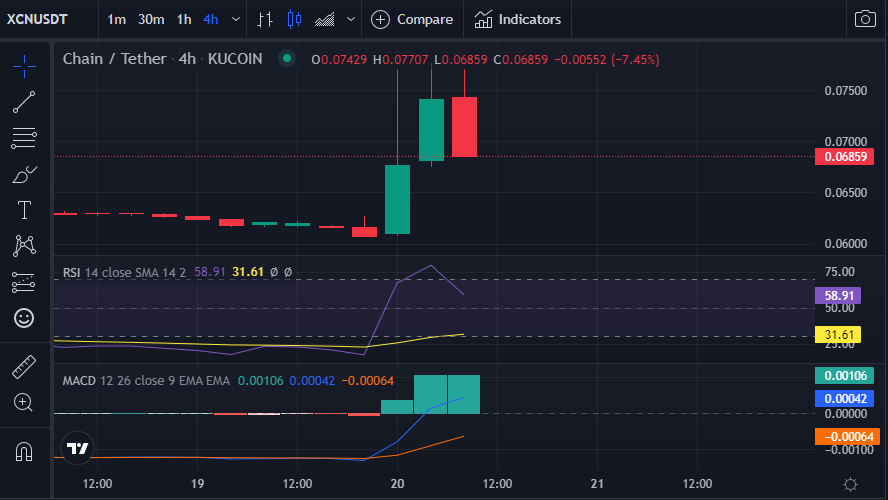
A distinct bullish trendline is seen on the 4-hour chart as the prices have recovered part of their lost value.
The bulls are in control of the market since the MACD blue line is going above the yellow signal line. Prices have created a bullish engulfing candlestick pattern, and the histogram is in the positive region, which will likely cause the prices to rise.
With a reading of 59.19, the Relative Strength Index (RSI) is neither overbought nor oversold. Market activity at this level is equivalent to both buying and selling.
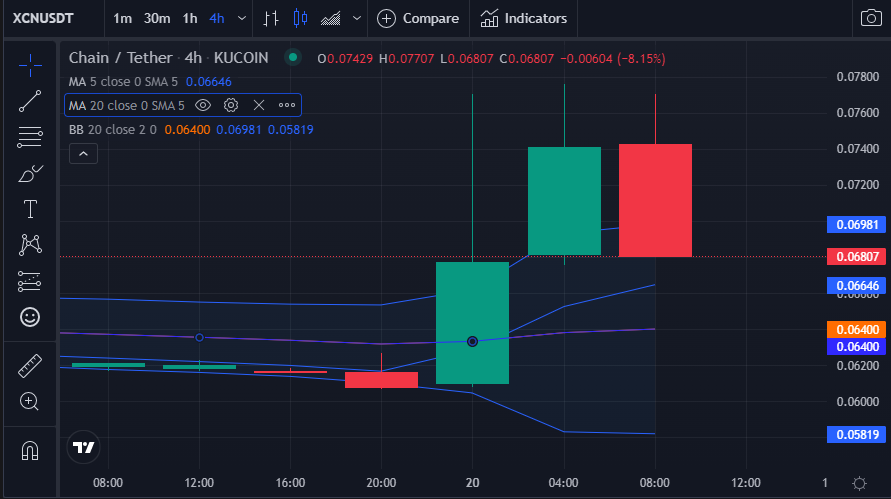
The 5-day MA crosses the 20-day MA, forming a golden cross on the charts. Strong trading volume, as shown in XCN, which had a 238.79% increase in trading volume, supports this pattern, which foretells the onset of a bull market. While the 20-day MA is at 0.06403, the 5-day MA is at 0.06658. Adding on, the market is above both Moving Averages, a positive trend.
The Bollinger Bands are enlarging on the 4-hour charts, touching at 0.06990 for the upper band and 0.05815, respectively. This action suggests increased market purchasing and selling pressure, which is a bullish indication. Adding on, the market is trending upward, indicating strong momentum.
Overall, the bears appear worn out because technical indicators are heading north, which suggests that the bullish momentum may continue.
Disclaimer: The views and opinions, as well as all the information shared in this price prediction, are published in good faith. Readers must do their research and due diligence. Any action taken by the reader is strictly at their own risk. Coin Edition and its affiliates will not be held liable for any direct or indirect damage or loss.
Disclaimer: The information presented in this article is for informational and educational purposes only. The article does not constitute financial advice or advice of any kind. Coin Edition is not responsible for any losses incurred as a result of the utilization of content, products, or services mentioned. Readers are advised to exercise caution before taking any action related to the company.


