


- According to recent analysis, the XRP market has been in bear territory in recent hours.
- Bulls give up in the race against XRP bears.
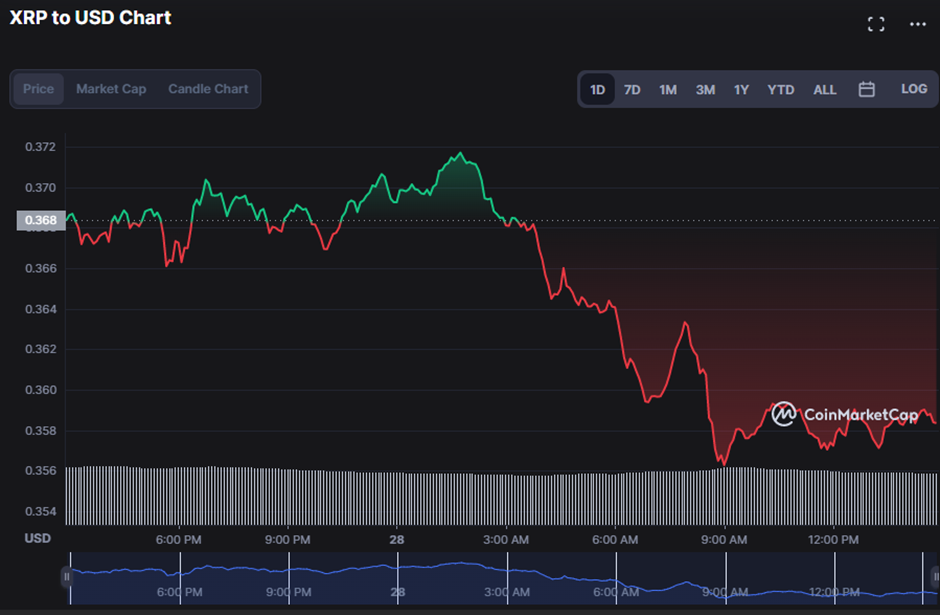
- The bearish trend in XRP persists, with prices falling to $0.3585.
Bears’ control of the XRP market was clear early on as its prices fell to an intraday low of $0.3562 before finding support. As of the time of this writing, the market has lost 2.76% of its value, dropping to $0.3585.
During the slump, both the market capitalization and the 24-hour trading volume plummeted by 2.73% to $18,055,387,561 and 12.46% to $911,147,706 respectively, bolstering the bearish sentiment in the XRP market.
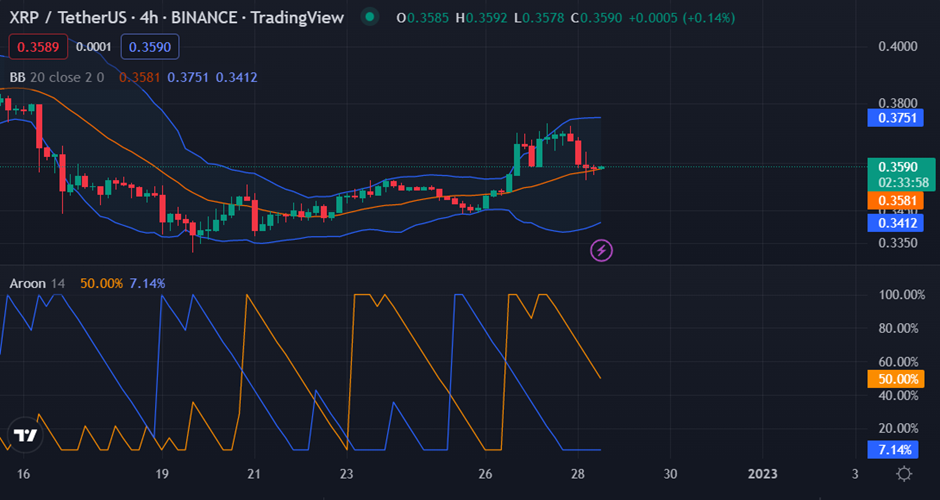
Selling pressure is outweighing buying pressure in the XRP market, as evidenced by the bollinger bands bulging on the price chart, with the upper band touching 0.3750 and the lower band touching 0.3412. These levels serve as immediate support and resistance levels in the short term.
When the Aroon up (blue) crosses below the Aroon down (orange), the bear grip on the XRP market is expected to tighten. This is demonstrated by the Aroon up and down readings of 7.14% and 50.00, respectively.
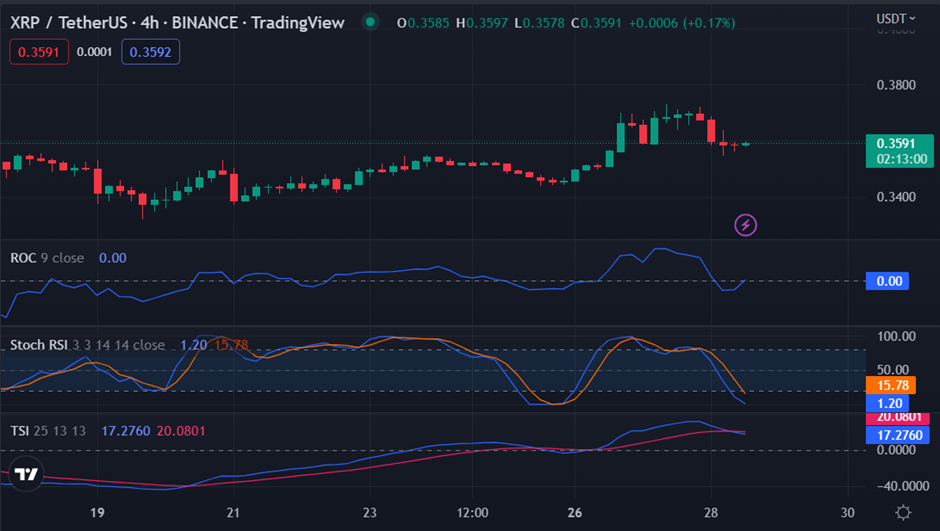
The Rate of Change (ROC) is in the negative territory, with a reading of 0.00, indicating that the market is in a bearish trend. The ROC pointing upwards, on the other hand, suggests that this bearish trend may be invalidated in the near term.
The stochastic RSI trajectory in the oversold region with a reading of 1.20 suggests that this bear trend may be invalidated in the near term. This, however, should only serve as a warning to traders to be on the lookout for a possible turnaround.
Furthermore, the True Strength Index (17.2763) falls below the signal line, indicating that bear hold is increasing in the XRP market. However, the TSI is still in the positive territory, indicating that the bulls have a chance to come back.
XRP may have a positive reversal if the bulls can hold the resistance level despite multiple signs pointing to another bear run.
Disclaimer: The views and opinions, as well as all the information shared in this price analysis, are published in good faith. Readers must do their own research and due diligence. Any action taken by the reader is strictly at their own risk, Coin Edition and its affiliates will not be held liable for any direct or indirect damage or loss.
Disclaimer: The information presented in this article is for informational and educational purposes only. The article does not constitute financial advice or advice of any kind. Coin Edition is not responsible for any losses incurred as a result of the utilization of content, products, or services mentioned. Readers are advised to exercise caution before taking any action related to the company.


