


- SHIB started its ascent lethargically but recovered well towards the latter part of the week.
- The token made frequent higher-lows than higher-high as the bears resisted the bulls.
- The market has corrected the prices after SHIB touched the upper BB band.
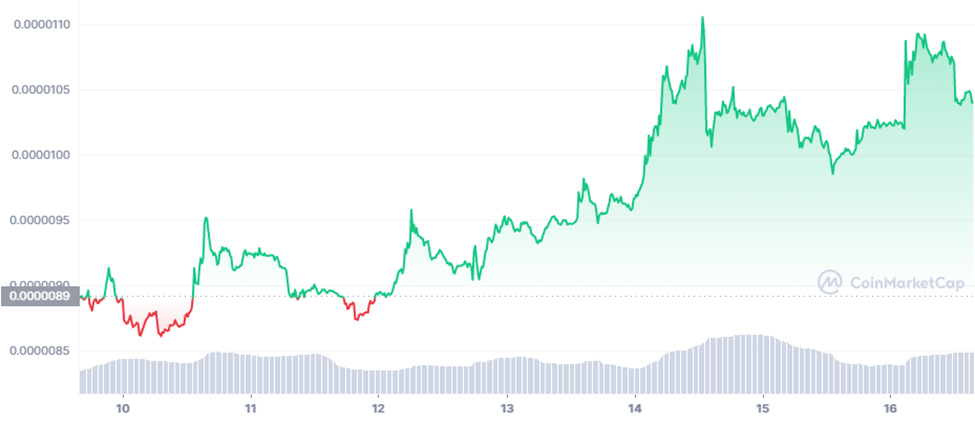
Shiba Inu (SHIB) started ascending through the price levels quite lethargically during the beginning of the week but recovered towards the latter part of the week. As shown in the chart below, Shiba Inu was constrained to fluctuating below the $0.0000095 limit for the first three and a half days of the week during which it explored the red zone rarely.
Although on two occasions SHIB found the momentum to break the $0.0000095 limit, it was still unable to retain the gained position. Towards the second half of the third day, the bulls took over the market and skyrocketed SHIB from $0.0000095 to $0.00001106 within 24 hours. This was the highest that SHIB reached for the week.
However, after Shiba Inu hit the highest price, the bulls lost control making way for the bears to interject. When the bears took over, SHIB tanked to $0.00001006 from its highest price within hours. The bears kept their stranglehold until the beginning of day seven from halfway through the fifth day.
Hence for almost one and a half days, SHIB’s movements were constricted between $0.0000100 and $0.0000105. Nonetheless, the token saw light at the end of the tunnel as it was able to break this limited range of motion.
When the chart below is considered, SHIB made higher-lows (Green triangles) more frequently than it made higher-highs (Red elliptical). This is due to the bears not letting the bulls off the hook.
As the hammer can be spotted, traders could have enjoyed a profit had they entered the market at the entry point ($0.00001011) and shorted their position at the “take profit” point ($0.00001067).
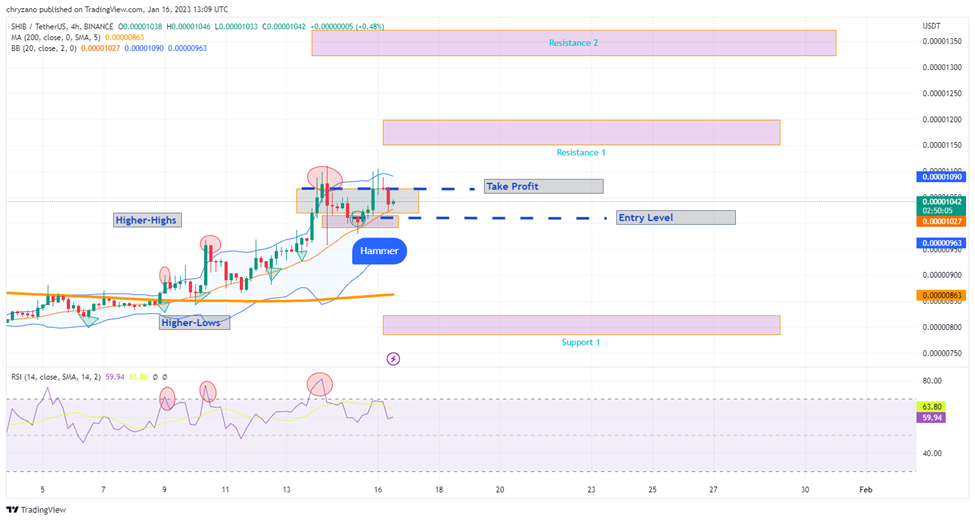
Earlier when SHIB was on a roll, the RS Indicator and SHIB made higher-highs simultaneously which indicates a bullish overview. But currently, SHIB is moving sideways and the RSI is at 59.94. This indicates that the sideways movement trend is well-set.
Although the market corrected the prices after SHIB touched the upper Bollinger band, there is still a possibility that the bulls could dominate and take SHIB to Resistance 1.
If the bears manage to nullify the bull’s throttle, then SHIB may move sideways. But if the bears gain the upper hand, Shiba Inu could tank to Support 1.
Disclaimer: The views and opinions, as well as all the information shared in this price analysis, are published in good faith. Readers must do their own research and due diligence. Any action taken by the reader is strictly at their own risk, Coin Edition and its affiliates will not be held liable for any direct or indirect damage or loss.
Disclaimer: The information presented in this article is for informational and educational purposes only. The article does not constitute financial advice or advice of any kind. Coin Edition is not responsible for any losses incurred as a result of the utilization of content, products, or services mentioned. Readers are advised to exercise caution before taking any action related to the company.
 Price Prediction 2026, 2027, 2028, 2029, 2030 -2050")


