


- ATOM price falls to a 7-day low due to bearish pressure.
- According to recent research, bulls have refuted bear momentum.
- Indicators indicate the upward trend may endure.
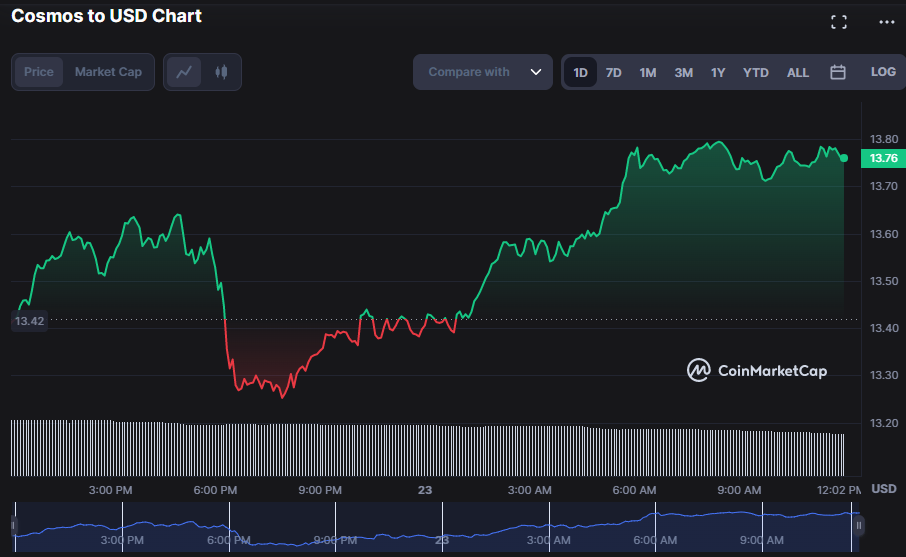
Cosmos (ATOM) bulls awoke after the price dropped to a 7-day low of $13.25, pushing it to an intraday high of $13.80. ATOM’s price has since stabilized in the $13.50 – $13.60 area, indicating growing investor confidence in the cryptocurrency’s potential value. At press time, the bullish intervention had increased the price by 2.60% to $13.76.
The market value increased by 2.56% during the upturn, reaching $3,939,430,281. This rapid influx of buying activity during this gloomy market indicates that investors are enthusiastic about ATOM’s prospects. However, despite this recent bullish intervention, it is still being determined if it was the product of genuine confidence or market manipulation, as 24-hour trading volume plummeted by 26.15% to $133,213,853.
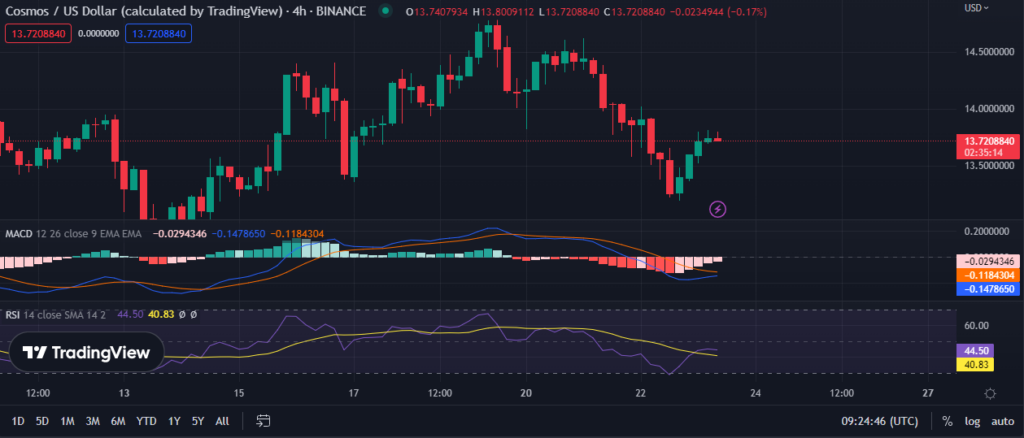
Although bullish, the blue MACD line on the 4-hour price chart swings in the negative zone with a value of -0.01433748, suggesting bearish momentum in the market. Moreover, the signal line moves in the negative zone with a value of -0.00038959, confirming the market’s bearish momentum. Finally, with a negative histogram score of -0.01374789, it’s clear that sellers control the market. This dip suggests the bearish momentum will likely carry over into the subsequent trading sessions.
The Relative Strength Index (RSI) is rising over its signal line with a score of 46.49, indicating that market sentiment favors buyers. While the MACD histogram and the signal line are declining, the higher RSI reading demonstrates that buyers are still in the market. The RSI pattern suggests that ATOM’s bullishness is growing, as it is now firmly in the buy zone with a score greater than 30, signaling the start of a bullish market trend. The RSI reading also portrays ATOM’s undervaluation, making it an intriguing option for investors looking for a good entry point into the market.
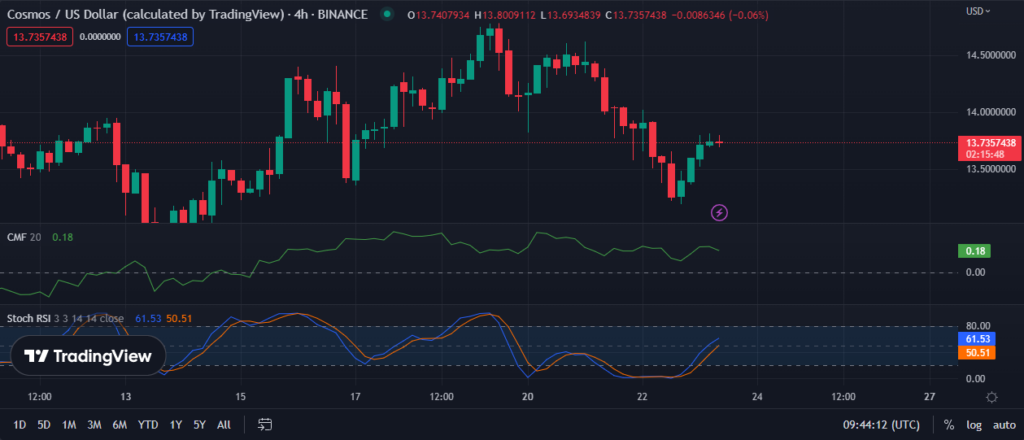
As the Chaikin Money Flow (CMF) is positive at 0.18, suggesting that more money gains by buying than is being taken out by sellers, the bullishness in ATOM may prolong. CMF movement into the positive territory indicates a more significant capital inflow into ATOM than outflow, signaling an upward price trend. ATOM will continue its bullish trend if the CMF remains favorable.
In addition, the fact that the stochastic RSI is rising and is now above its signal line at 60.98 indicates that buyers are actively participating in the market. As there is now more demand than supply, ATOM may rise in price. Overall, this strengthens the bullish thesis for ATOM, and investors should keep an eye out for buying opportunities.
If the bullishness in the ATOM market continues, bulls must keep increasing prices in the near term.
Disclaimer: The views and opinions, as well as all the information shared in this price prediction, are published in good faith. Readers must do their research and due diligence. Any action taken by the reader is strictly at their own risk. Coin Edition and its affiliates will not be held liable for any direct or indirect damage or loss.
Disclaimer: The information presented in this article is for informational and educational purposes only. The article does not constitute financial advice or advice of any kind. Coin Edition is not responsible for any losses incurred as a result of the utilization of content, products, or services mentioned. Readers are advised to exercise caution before taking any action related to the company.

: What Happens If You Use an Unlicensed Platform?")


