


 Prices by More Than 1.80% to $4.45")
- ApeCoin price analysis reveals a steady upward trend.
- APE has support at $4.17 and resistance at $4.56.
- In the last few hours, APE prices have risen by more than 1.80 %.
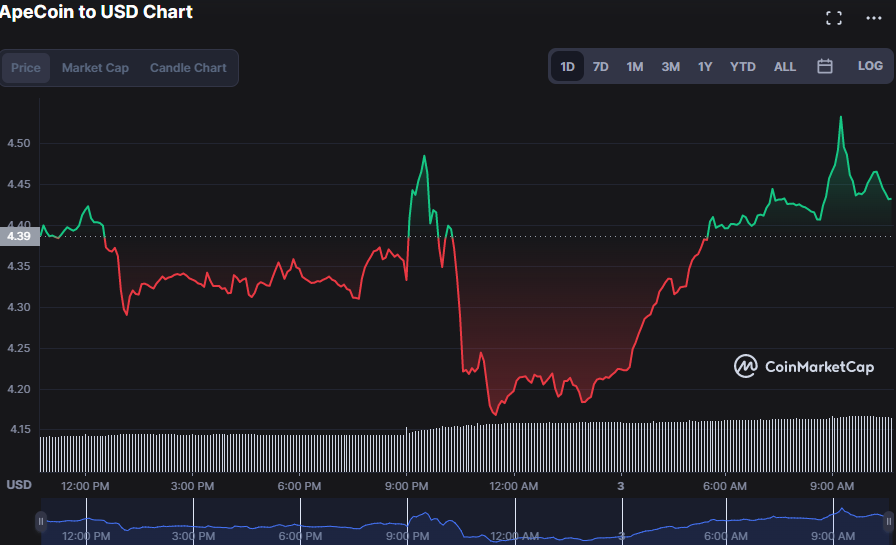
ApeCoin (APE) has recently been in a distinct upward trend, according to the price analysis of the daily price chart.
APE prices have risen by 1.80% to $4.45 at the time of writing. The bulls dominated and controlled the market from the low of $4.17 to the most recent high. Market capitalization increased by 1.44% to $1,357,532,949, while trading volume surged by 58.26% to 266,985,513
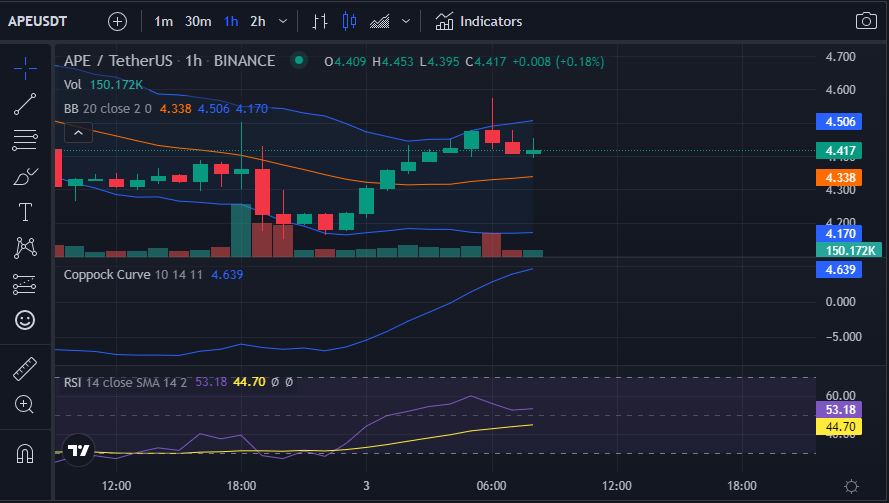
A positive trend is on the way because the Coppock Curve is at 4.682 and continues to rise above the zero line. This is a bullish indicator for APE investors, indicating that they should hold onto their investment.
The widening of the Bollinger Bands implies an increase in purchasing and selling pressure in the ApeCoin market. The upper band is at 4.506, and the bottom band is at 4.170. In addition to the positive support, the market price is heading toward the upper band, indicating that the bullish momentum will continue.
The Relative Strength Index (RSI) of 53.28 and trending north implies a stable market with increased market volatility. This price fluctuation indicates that the upward trend will continue.
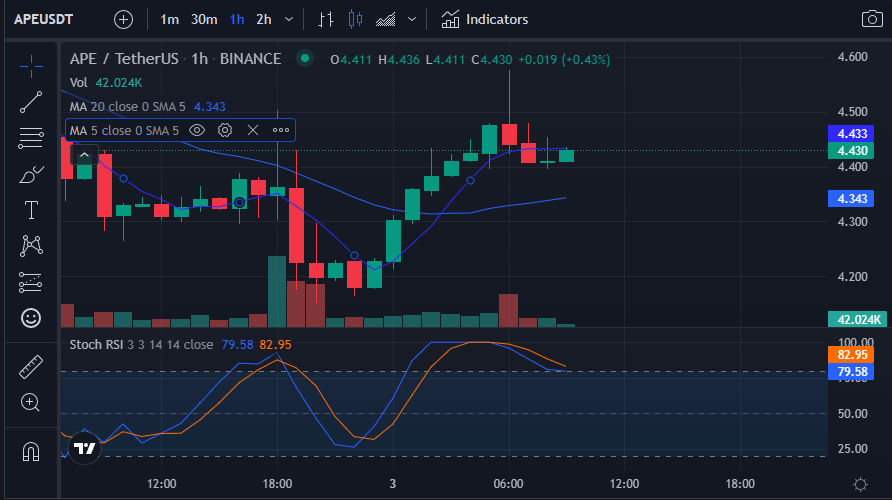
The Stoch RSI was trending in the overbought range, albeit still bearish, in recent hours, but it has since reverted lower, reading 78.98 and pointing south. This movement has resulted in a positive trend in the APE market, which could last as long as the Stoch RSI score remains between the overbought and oversold levels.
The 5-day Moving Average crosses above the 20-day Moving Average, forming a golden cross on the 1-hour price chart which is a positive sentiment. While the 5-day moving average is at 4.433, the 20-day moving average is at 4.343.
Technical indicators point to a further bullish run in the ApeCoin (APE) market as the bulls continue controlling the market.
Disclaimer: The views and opinions, as well as all the information shared in this price analysis, are published in good faith. Readers must do their own research and due diligence. Any action taken by the reader is strictly at their own risk, Coin Edition and its affiliates will not be held liable for any direct or indirect damage or loss
Disclaimer: The information presented in this article is for informational and educational purposes only. The article does not constitute financial advice or advice of any kind. Coin Edition is not responsible for any losses incurred as a result of the utilization of content, products, or services mentioned. Readers are advised to exercise caution before taking any action related to the company.


