


- The intraday low for SHIB was $0.0000116.
- Shiba Inu price analysis shows a bearish trend.
- The question arises: will the bulls be able to push prices up or will the bears take control?
Recent Shiba Inu price analysis indicates the intraday low for SHIB was $0.0000116 and since then, the bulls have been trying to push prices up. However, the bears seem to be in control as of now and prices are currently trading at $0.00001177.
It is important to note that SHIB had seen a massive decline in prices overnight, however, in the last few hours, it has started to slowly recover. Shiba Inu is currently down by 2.64 percent and the 24 hours low is $0.0000116 while the 24-hour high is $0.00001216.
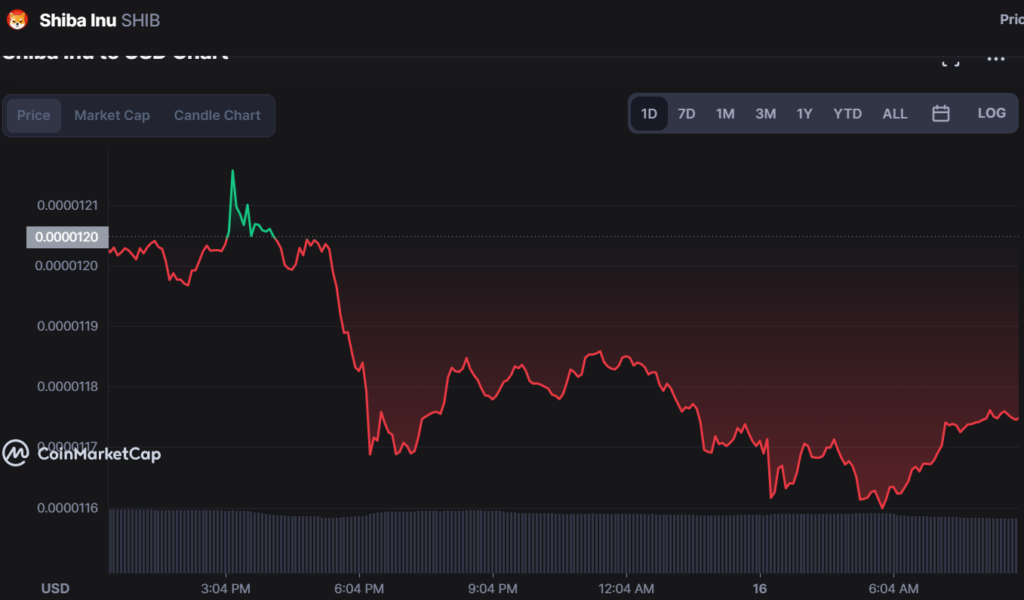
The market capitalization for SHIB currently stands at $6.4 billion and the 24-hour trading volume is at $273,260,522.89.
As of now, the bulls are trying to push prices up but the bears seem to be in control. It remains to be seen whether the bulls will be able to take control or the bears will continue to push prices down. The 4-hour chart for SHIB/USD shows that the bulls have been trying to push prices up but have so far failed to do so. Prices are currently trading just below the $0.000012 resistance level.
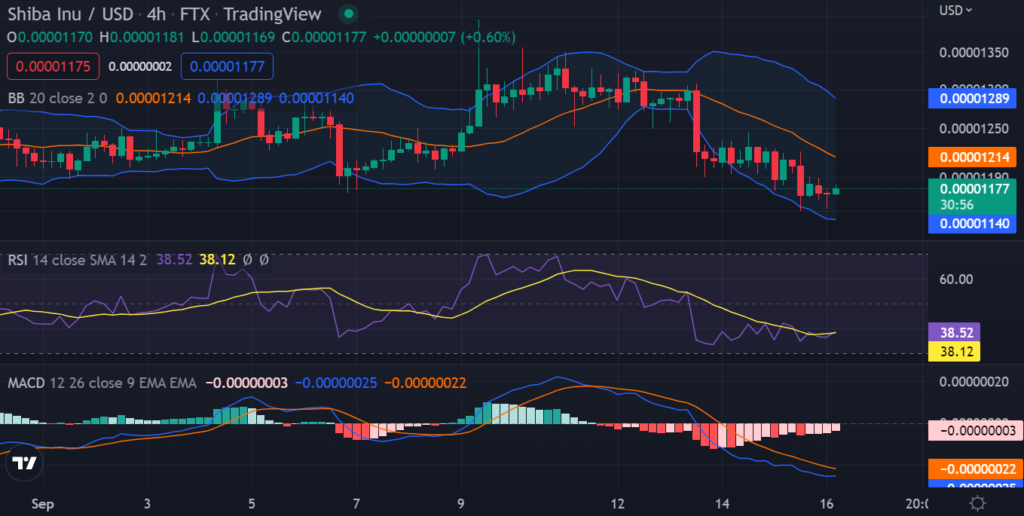
There is a bearish trend line forming with resistance around $0.000012. The MACD indicator is in the bearish zone and the RSI indicator is just below the 50 level, which indicates that the bears are in control as of now.
The hourly chart for SHIB/USD shows that prices have formed a symmetrical triangle pattern and are currently trading near the $0.000012 resistance level. The candlesticks are currently trading below the 20 and 50-day moving averages, which is a bearish sign.
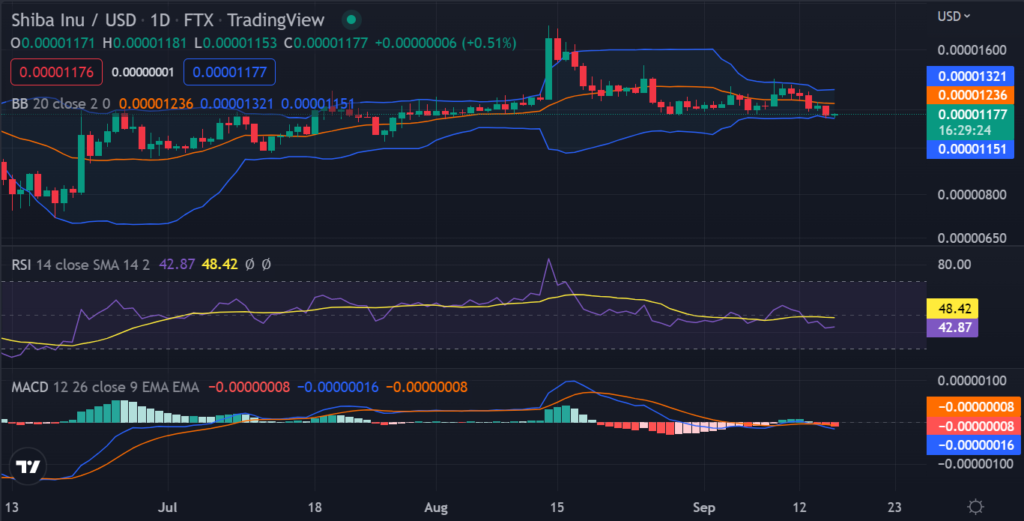
On the 24-hour price chart, a descending triangle pattern is visible which is a bearish sign. The RSI indicator is currently just below the 50 levels and the MACD indicator is in the bearish zone, which indicates that the bears are in control of the market.
In conclusion, The Shiba Inu price analysis shows that the bulls have been trying to push prices up but have so far failed to do so. The market is expected to remain volatile as the bulls and bears battle for control.
The Bollinger bands are significantly wide on the 4-hour chart, indicating that a major move is expected in the market.
Disclaimer: The views and opinions, as well as all the information shared in this price prediction, are published in good faith. Readers must do their research and due diligence. Any action taken by the reader is strictly at their own risk. Coin Edition and its affiliates will not be held liable for any direct or indirect damage or loss.
Disclaimer: The information presented in this article is for informational and educational purposes only. The article does not constitute financial advice or advice of any kind. Coin Edition is not responsible for any losses incurred as a result of the utilization of content, products, or services mentioned. Readers are advised to exercise caution before taking any action related to the company.


